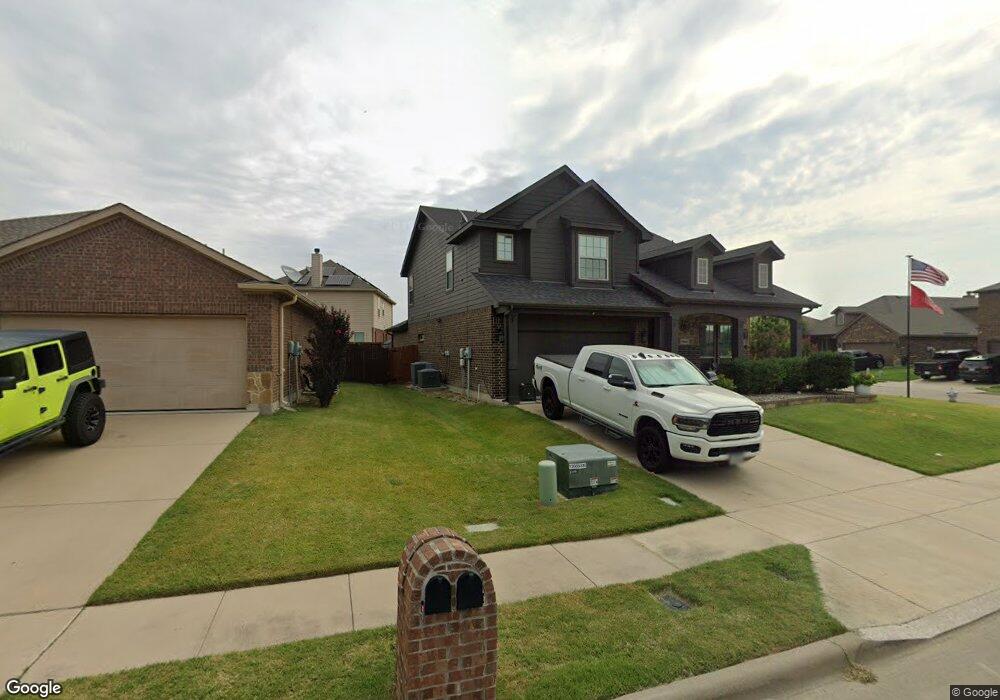
11024 Erinmoor Trail Haslet, TX 76052
Estimated Value: $382,842 - $437,000
4
Beds
3
Baths
2,655
Sq Ft
$153/Sq Ft
Est. Value
About This Home
This home is located at 11024 Erinmoor Trail, Haslet, TX 76052 and is currently estimated at $405,711, approximately $152 per square foot. 11024 Erinmoor Trail is a home located in Tarrant County with nearby schools including Leo Adams Middle School, V.R. Eaton High School, and International Leadership Of Texas Elementary - Keller.
Ownership History
Date
Name
Owned For
Owner Type
Purchase Details
Closed on
Aug 13, 2018
Sold by
Pritchett Zachary T and Pritchett Angela Mitchelle
Bought by
Day Kyle K and Ibarra Oropeza Yadira
Current Estimated Value
Home Financials for this Owner
Home Financials are based on the most recent Mortgage that was taken out on this home.
Original Mortgage
$261,497
Outstanding Balance
$227,100
Interest Rate
4.5%
Mortgage Type
Purchase Money Mortgage
Estimated Equity
$178,611
Purchase Details
Closed on
Nov 5, 2014
Sold by
D R Horton Texas Ltd
Bought by
Pritchett Zachary T and Pritchett Angela Michelle
Home Financials for this Owner
Home Financials are based on the most recent Mortgage that was taken out on this home.
Original Mortgage
$205,096
Interest Rate
4.75%
Mortgage Type
FHA
Create a Home Valuation Report for This Property
The Home Valuation Report is an in-depth analysis detailing your home's value as well as a comparison with similar homes in the area
Home Values in the Area
Average Home Value in this Area
Purchase History
| Date | Buyer | Sale Price | Title Company |
|---|---|---|---|
| Day Kyle K | -- | Old Republic Title Co | |
| Pritchett Zachary T | -- | Dhi |
Source: Public Records
Mortgage History
| Date | Status | Borrower | Loan Amount |
|---|---|---|---|
| Open | Day Kyle K | $261,497 | |
| Previous Owner | Pritchett Zachary T | $205,096 |
Source: Public Records
Tax History Compared to Growth
Tax History
| Year | Tax Paid | Tax Assessment Tax Assessment Total Assessment is a certain percentage of the fair market value that is determined by local assessors to be the total taxable value of land and additions on the property. | Land | Improvement |
|---|---|---|---|---|
| 2025 | $3,470 | $345,000 | $75,000 | $270,000 |
| 2024 | $3,470 | $385,221 | $75,000 | $310,221 |
| 2023 | $7,861 | $418,209 | $45,000 | $373,209 |
| 2022 | $8,099 | $334,851 | $45,000 | $289,851 |
| 2021 | $8,042 | $286,971 | $45,000 | $241,971 |
| 2020 | $7,424 | $269,383 | $45,000 | $224,383 |
| 2019 | $7,746 | $269,951 | $45,000 | $224,951 |
| 2018 | $2,973 | $243,190 | $45,000 | $198,190 |
| 2017 | $6,443 | $221,385 | $28,000 | $193,385 |
| 2016 | $5,857 | $204,266 | $28,000 | $176,266 |
| 2015 | $611 | $182,713 | $28,000 | $154,713 |
| 2014 | $611 | $28,000 | $28,000 | $0 |
Source: Public Records
Map
Nearby Homes
- 441 Delgany Trail
- 1401 Thunderbird Dr
- 11029 Hawks Landing Rd
- 11045 Temple Gardens Trail
- 424 Baverton Ln
- 10864 Irish Glen Trail
- 10901 Irish Glen Trail
- 10861 Middleglen Rd
- 11308 Guinness Dr
- 10901 Middleglen Rd
- 10913 Middleglen Rd
- 10832 Hawks Landing Rd
- 545 Winbridge Ln
- 10820 Middleglen Rd
- 232 Drumcliffe Dr
- 11301 Golden Ridge Ln
- 653 Mistymoor Ln
- 10748 Irish Glen Trail
- 209 Irish Moss Dr
- 10745 Irish Glen Trail
- 11032 Erinmoor Trail
- 11101 Dunlavin Ct
- 11040 Erinmoor Trail
- 1100 Erinmoor Trail
- 11105 Dunlavin Ct
- 11025 Erinmoor Trail
- 541 Delgany Trail
- 11021 Erinmoor Trail
- 11109 Dunlavin Ct
- 11048 Erinmoor Trail
- 11029 Erinmoor Trail
- 537 Delgany Trail
- 533 Delgany Trail
- 533 Delgany Trail
- 11017 Erinmoor Trail
- 11033 Erinmoor Trail
- 11052 Erinmoor Trail
- 529 Delgany Trail
- 11016 Erinmoor Trail
- 11113 Dunlavin Ct