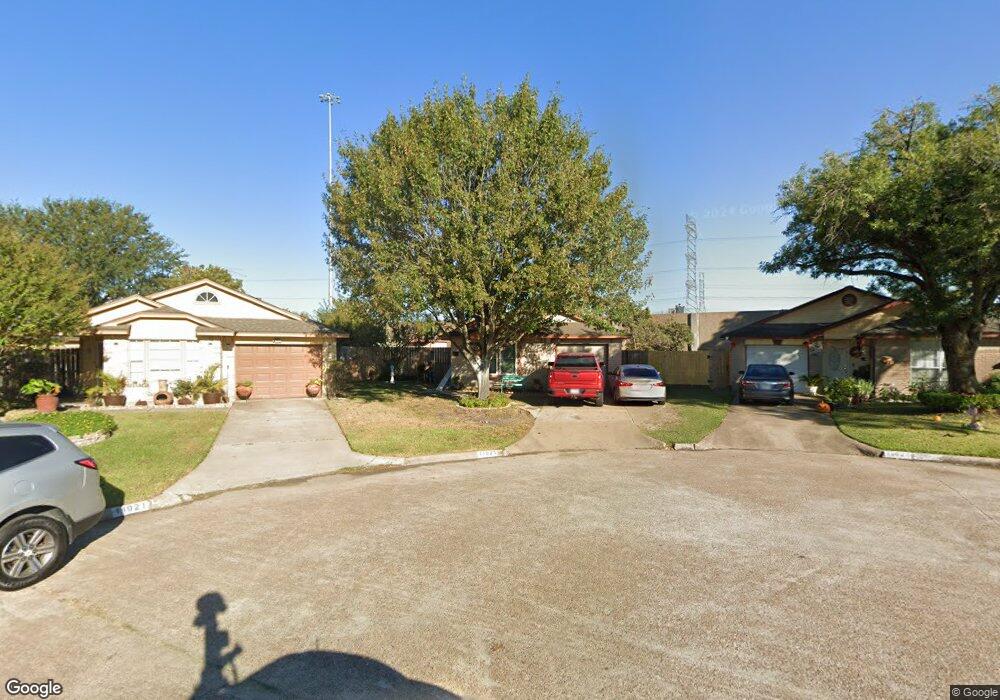
11025 Cottontop Ct Houston, TX 77086
North Houston NeighborhoodEstimated Value: $183,778 - $223,000
3
Beds
2
Baths
1,444
Sq Ft
$137/Sq Ft
Est. Value
About This Home
This home is located at 11025 Cottontop Ct, Houston, TX 77086 and is currently estimated at $197,695, approximately $136 per square foot. 11025 Cottontop Ct is a home located in Harris County with nearby schools including Kujawa EC/Pre-K/K School, Carmichael Elementary School, and Shotwell Middle School.
Ownership History
Date
Name
Owned For
Owner Type
Purchase Details
Closed on
Oct 11, 2005
Sold by
Bowers Lauren M
Bought by
Flores Eusebio A
Current Estimated Value
Home Financials for this Owner
Home Financials are based on the most recent Mortgage that was taken out on this home.
Original Mortgage
$85,000
Outstanding Balance
$45,180
Interest Rate
5.65%
Mortgage Type
Fannie Mae Freddie Mac
Estimated Equity
$152,515
Purchase Details
Closed on
Jun 16, 2005
Sold by
Bowers Merrill F
Bought by
Bowers Lauren M
Purchase Details
Closed on
Sep 28, 2001
Sold by
Fairchild William Mark
Bought by
Bowers Lauren M and Bowers Merrill F
Home Financials for this Owner
Home Financials are based on the most recent Mortgage that was taken out on this home.
Original Mortgage
$47,600
Interest Rate
9.37%
Create a Home Valuation Report for This Property
The Home Valuation Report is an in-depth analysis detailing your home's value as well as a comparison with similar homes in the area
Home Values in the Area
Average Home Value in this Area
Purchase History
| Date | Buyer | Sale Price | Title Company |
|---|---|---|---|
| Flores Eusebio A | -- | Startex Title Company | |
| Bowers Lauren M | -- | -- | |
| Bowers Lauren M | -- | Alamo Title Company |
Source: Public Records
Mortgage History
| Date | Status | Borrower | Loan Amount |
|---|---|---|---|
| Open | Flores Eusebio A | $85,000 | |
| Previous Owner | Bowers Lauren M | $47,600 | |
| Closed | Bowers Lauren M | $0 |
Source: Public Records
Tax History Compared to Growth
Tax History
| Year | Tax Paid | Tax Assessment Tax Assessment Total Assessment is a certain percentage of the fair market value that is determined by local assessors to be the total taxable value of land and additions on the property. | Land | Improvement |
|---|---|---|---|---|
| 2025 | $1,651 | $186,433 | $32,680 | $153,753 |
| 2024 | $1,651 | $182,742 | $27,360 | $155,382 |
| 2023 | $1,651 | $185,375 | $27,360 | $158,015 |
| 2022 | $2,542 | $161,424 | $20,520 | $140,904 |
| 2021 | $2,428 | $136,041 | $20,520 | $115,521 |
| 2020 | $2,349 | $131,269 | $20,520 | $110,749 |
| 2019 | $2,274 | $124,602 | $20,520 | $104,082 |
| 2018 | $792 | $91,205 | $20,520 | $70,685 |
| 2017 | $1,994 | $91,205 | $20,520 | $70,685 |
| 2016 | $1,813 | $66,249 | $20,520 | $45,729 |
| 2015 | $1,749 | $67,541 | $11,400 | $56,141 |
| 2014 | $1,749 | $69,461 | $11,400 | $58,061 |
Source: Public Records
Map
Nearby Homes
- 7227 Greenyard Dr
- 7222 Northleaf Dr
- 7218 Winding Trace Dr
- 5010 Kale Ct
- 5103 Dartmoor Ridge Trail
- 11007 Tobasa Ct
- 10711 Heather Hill Dr
- 10723 Mackenzie Dr
- 10614 Mackenzie Dr
- 7023 Sandswept Ln
- 7002 Sandswept Ln
- 11006 Crinkleawn Dr
- 11021 Crenchrus Ct
- 11532 Champions Green Dr
- 10307 Bammel North Houston Rd
- 6722 Winding Trace Dr
- 6654 Brownie Campbell Rd
- 11009 Panicum Ct
- 7302 Seton Lake Dr
- 6610 Northleaf Dr
- 11021 Cottontop Ct
- 11024 Cottontop Ct
- 11022 Little Barley Ct
- 11020 Little Barley Ct
- 11017 Cottontop Ct
- 11022 Cottontop Ct
- 11016 Little Barley Ct
- 11020 Cottontop Ct
- 11015 Cottontop Ct
- 11024 Little Barley Ct
- 11016 Cottontop Ct
- 11014 Little Barley Ct
- 11011 Cottontop Ct
- 11014 Cottontop Ct
- 11021 Beaver Trail Dr
- 11012 Little Barley Ct
- 11025 Little Barley Ct
- 11025 Beaver Trail Dr
- 11009 Cottontop Ct
- 11012 Cottontop Ct