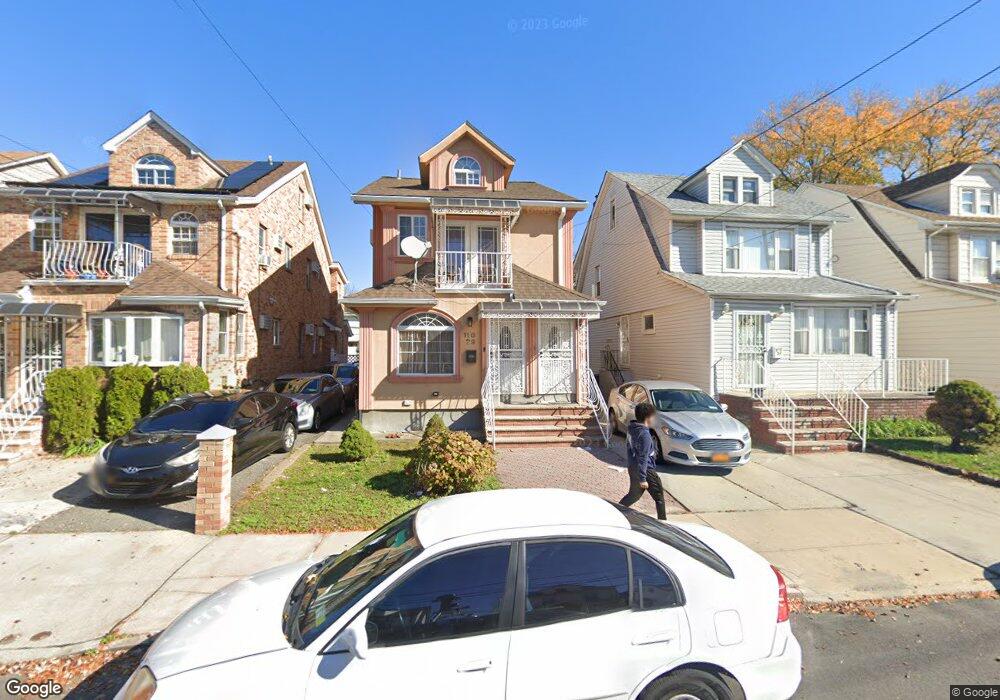
11029 178th St Jamaica, NY 11433
Jamaica NeighborhoodEstimated Value: $844,261 - $1,595,000
--
Bed
--
Bath
2,326
Sq Ft
$471/Sq Ft
Est. Value
About This Home
This home is located at 11029 178th St, Jamaica, NY 11433 and is currently estimated at $1,096,315, approximately $471 per square foot. 11029 178th St is a home located in Queens County with nearby schools including P.S./I.S. 116 William C Hughley and I.S. 238 Susan B Anthony Academy.
Ownership History
Date
Name
Owned For
Owner Type
Purchase Details
Closed on
Aug 21, 2013
Sold by
Yani 1 Corp
Bought by
Rankin Gem and Rankin Renita
Current Estimated Value
Home Financials for this Owner
Home Financials are based on the most recent Mortgage that was taken out on this home.
Original Mortgage
$489,961
Outstanding Balance
$363,687
Interest Rate
4.42%
Mortgage Type
New Conventional
Estimated Equity
$732,628
Purchase Details
Closed on
Jan 2, 2013
Sold by
Benishty Yaniv
Bought by
Yani 1 Corp
Home Financials for this Owner
Home Financials are based on the most recent Mortgage that was taken out on this home.
Original Mortgage
$285,000
Interest Rate
3.44%
Mortgage Type
New Conventional
Purchase Details
Closed on
May 18, 2007
Sold by
Animashaun Jemilat
Bought by
Onanuga Oluwamodupe
Home Financials for this Owner
Home Financials are based on the most recent Mortgage that was taken out on this home.
Original Mortgage
$99,999
Interest Rate
6.24%
Create a Home Valuation Report for This Property
The Home Valuation Report is an in-depth analysis detailing your home's value as well as a comparison with similar homes in the area
Home Values in the Area
Average Home Value in this Area
Purchase History
| Date | Buyer | Sale Price | Title Company |
|---|---|---|---|
| Rankin Gem | $499,000 | -- | |
| Rankin Gem | $499,000 | -- | |
| Yani 1 Corp | -- | -- | |
| Benishty Yaniv | $299,000 | -- | |
| Yani 1 Corp | -- | -- | |
| Benishty Yaniv | $299,000 | -- | |
| Onanuga Oluwamodupe | $668,150 | -- | |
| Onanuga Oluwamodupe | $668,150 | -- |
Source: Public Records
Mortgage History
| Date | Status | Borrower | Loan Amount |
|---|---|---|---|
| Open | Rankin Gem | $489,961 | |
| Closed | Rankin Gem | $489,961 | |
| Previous Owner | Yani 1 Corp | $285,000 | |
| Previous Owner | Onanuga Oluwamodupe | $99,999 | |
| Previous Owner | Onanuga Oluwamodupe | $533,850 |
Source: Public Records
Tax History Compared to Growth
Tax History
| Year | Tax Paid | Tax Assessment Tax Assessment Total Assessment is a certain percentage of the fair market value that is determined by local assessors to be the total taxable value of land and additions on the property. | Land | Improvement |
|---|---|---|---|---|
| 2025 | $6,376 | $34,649 | $7,478 | $27,171 |
| 2024 | $6,388 | $33,143 | $8,572 | $24,571 |
| 2023 | $6,064 | $31,594 | $8,983 | $22,611 |
| 2022 | $5,741 | $44,520 | $13,920 | $30,600 |
| 2021 | $5,781 | $37,680 | $13,920 | $23,760 |
| 2020 | $5,816 | $34,620 | $13,920 | $20,700 |
| 2019 | $5,485 | $38,160 | $13,920 | $24,240 |
| 2018 | $5,069 | $26,328 | $13,634 | $12,694 |
| 2017 | $4,830 | $25,164 | $11,515 | $13,649 |
| 2016 | $4,500 | $25,164 | $11,515 | $13,649 |
| 2015 | $2,863 | $24,062 | $12,466 | $11,596 |
| 2014 | $2,863 | $23,016 | $12,069 | $10,947 |
Source: Public Records
Map
Nearby Homes
- 17718 Sayres Ave
- 177-08 Sayres Ave
- 10944 177th St
- 109-49 176th St
- 110-40 176th St
- 111-54 178th Place
- 17709 112th Ave
- 110-01 175th St
- 112- 2 178th St
- 11176 180th St
- 10912 176th St
- 112-13 178th St
- 112-26 176th St
- 112-45 178th St
- 11245 178th St
- 10779 Watson Place
- 173-15 109th Ave
- 11023 172nd St
- 183-12 Elmira Ave
- 108-32 174th St
- 11033 178th St
- 11027 178th St
- 110-33 178th St Unit Duplex
- 11027 178th St
- 11035 178th St
- 11023 178th St
- 11039 178th St
- 11021 178th St
- 11021 178th St
- 11034 179th St
- 11030 179th St
- 11028 179th St
- 11028 179th St
- 11017 178th St
- 11024 179th St
- 178 155th St
- 11017 178th St
- 11017 178th St
- 11032 178th St
- 11015 178th St