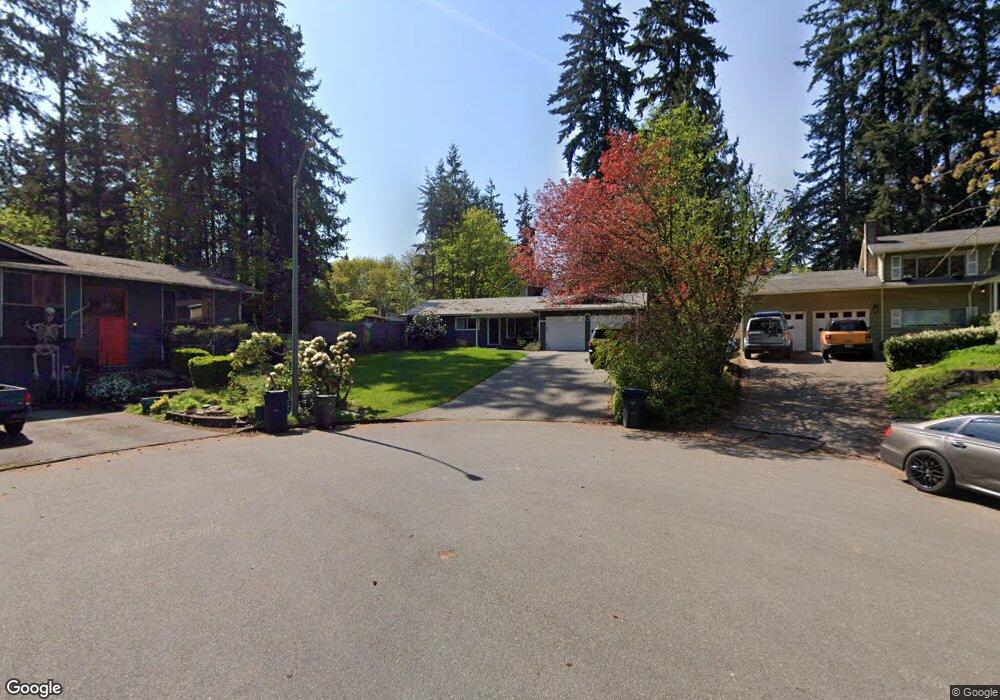
1103 203rd Place SE Bothell, WA 98012
Queensborough-Brentwood NeighborhoodEstimated Value: $757,000 - $837,000
3
Beds
2
Baths
1,220
Sq Ft
$651/Sq Ft
Est. Value
About This Home
This home is located at 1103 203rd Place SE, Bothell, WA 98012 and is currently estimated at $794,137, approximately $650 per square foot. 1103 203rd Place SE is a home located in Snohomish County with nearby schools including Crystal Springs Elementary School, Canyon Park Junior High School, and Bothell High School.
Ownership History
Date
Name
Owned For
Owner Type
Purchase Details
Closed on
Dec 4, 2015
Sold by
Herman Adam R
Bought by
Herman Adam R and Fox Sarah R
Current Estimated Value
Purchase Details
Closed on
Feb 27, 2007
Sold by
Larson Susan C
Bought by
Herman Adam R
Home Financials for this Owner
Home Financials are based on the most recent Mortgage that was taken out on this home.
Original Mortgage
$67,400
Outstanding Balance
$40,684
Interest Rate
6.21%
Mortgage Type
Unknown
Estimated Equity
$753,453
Purchase Details
Closed on
Aug 24, 2004
Sold by
Anthony Patrick L and Anthony Patricia A
Bought by
Larson Susan C
Home Financials for this Owner
Home Financials are based on the most recent Mortgage that was taken out on this home.
Original Mortgage
$200,000
Interest Rate
4%
Mortgage Type
Purchase Money Mortgage
Create a Home Valuation Report for This Property
The Home Valuation Report is an in-depth analysis detailing your home's value as well as a comparison with similar homes in the area
Home Values in the Area
Average Home Value in this Area
Purchase History
| Date | Buyer | Sale Price | Title Company |
|---|---|---|---|
| Herman Adam R | -- | None Available | |
| Herman Adam R | $337,000 | First American | |
| Larson Susan C | $250,000 | Fidelity National Title |
Source: Public Records
Mortgage History
| Date | Status | Borrower | Loan Amount |
|---|---|---|---|
| Open | Herman Adam R | $67,400 | |
| Open | Herman Adam R | $269,600 | |
| Previous Owner | Larson Susan C | $200,000 | |
| Closed | Larson Susan C | $50,000 |
Source: Public Records
Tax History Compared to Growth
Tax History
| Year | Tax Paid | Tax Assessment Tax Assessment Total Assessment is a certain percentage of the fair market value that is determined by local assessors to be the total taxable value of land and additions on the property. | Land | Improvement |
|---|---|---|---|---|
| 2025 | $5,208 | $631,000 | $440,000 | $191,000 |
| 2024 | $5,208 | $616,600 | $420,000 | $196,600 |
| 2023 | $5,401 | $697,200 | $475,000 | $222,200 |
| 2022 | $5,077 | $524,500 | $335,000 | $189,500 |
| 2020 | $4,424 | $424,400 | $261,000 | $163,400 |
| 2019 | $3,925 | $385,200 | $225,000 | $160,200 |
| 2018 | $3,837 | $355,400 | $210,000 | $145,400 |
| 2017 | $3,048 | $288,600 | $150,000 | $138,600 |
| 2016 | $2,983 | $273,700 | $140,000 | $133,700 |
| 2015 | $2,892 | $249,500 | $131,000 | $118,500 |
| 2013 | $2,691 | $201,500 | $106,000 | $95,500 |
Source: Public Records
Map
Nearby Homes
- 20411 14th Dr SE
- 1529 201st Place SE Unit 12C
- 807 Grimes Rd
- 20318 Bothell Everett Hwy Unit A303
- 20320 Bothell Everett Hwy Unit D204
- 20320 Bothell Everett Hwy Unit D301
- 20029 7th Ave SE
- 20022 7th Ave SE
- 20018 7th Ave SE
- 20025 6th Dr SE
- The Huntington A Plan at Harvest Trails
- The Kingston Plan at Harvest Trails
- The Claremont B Plan at Harvest Trails
- The Regis Plan at Harvest Trails
- The Huntington B Plan at Harvest Trails
- 19722 Filbert Dr Unit 3
- 19722 Filbert Dr Unit B-5
- 19722 Filbert Dr Unit 9
- 1522 196th St SE Unit C103
- 532 198th St SE
- 1110 203rd Place SE
- 1105 203rd Place SE
- 20325 10th Dr SE
- 20319 10th Dr SE
- 1033 204th Place SE
- 1118 203rd Place SE
- 20304 11th Dr SE
- 20303 10th Dr SE
- 1031 204th Place SE
- 20323 10th Dr SE
- 1113 204th Place SE
- 20230 11th Dr SE
- 1126 203rd Place SE
- 1105 204th Place SE
- 20322 10th Dr SE
- 1030 204th Place SE
- 20310 10th Dr SE
- 1127 204th Place SE
- 20249 11th Dr SE