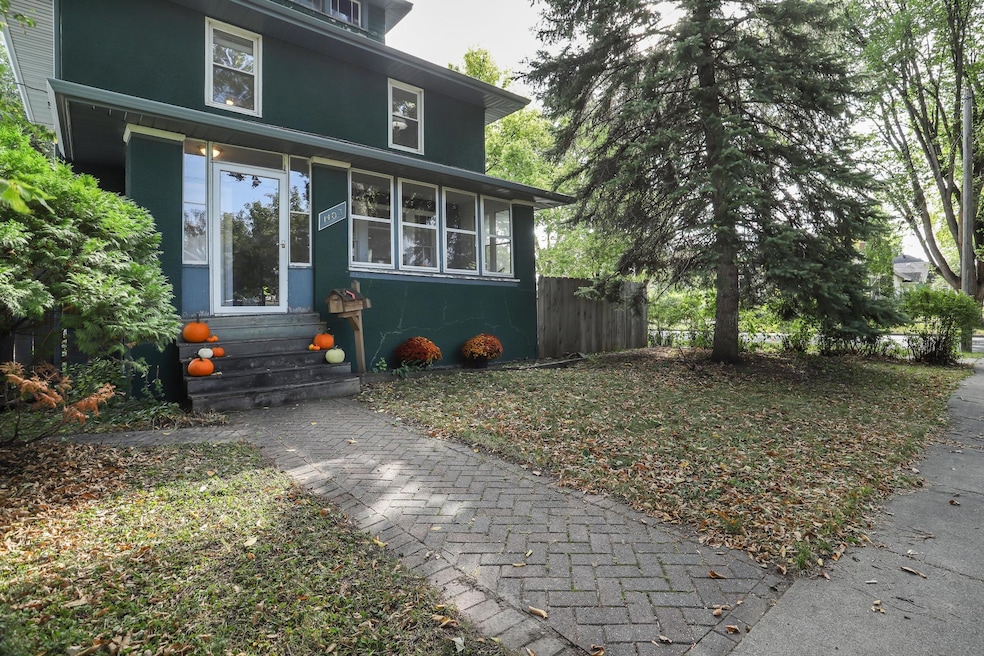
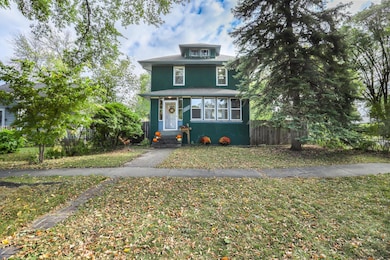
1103 2nd St N Fargo, ND 58102
Horace Mann NeighborhoodEstimated payment $1,858/month
Highlights
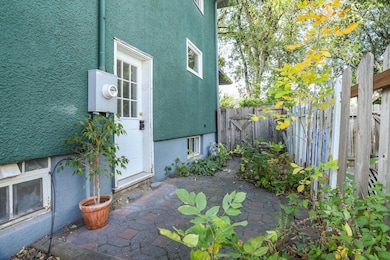
- Corner Lot
- No HOA
- Laundry Room
- Horace Mann Roosevelt Elementary School Rated 9+
- Living Room
- Forced Air Heating and Cooling System
About This Home
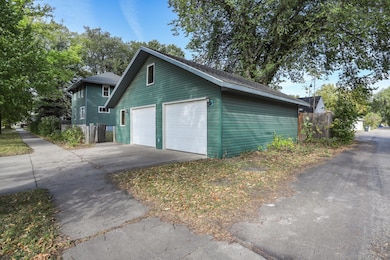
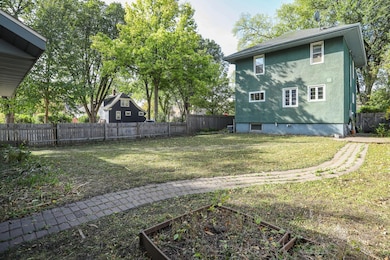
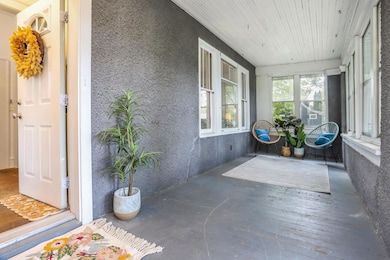
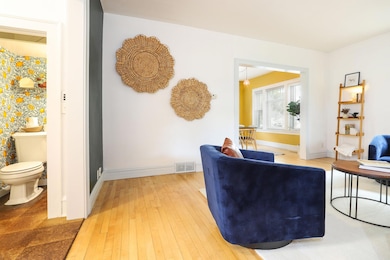
This beautiful two-story home blends classic character with modern comfort. Featuring 4 bedrooms and 3 baths, it offers plenty of space for everyday living and entertaining with a bathroom conveniently located on every level. The layout includes bright living areas, well-kept finishes, and thoughtful updates that highlight the home’s original charm. Outside, you’ll find a fully fenced yard on a corner lot, perfect for relaxing outdoors. The 2.5 stall garage includes a loft above that’s ideal for entertaining, a hobby space, or extra storage. A great mix of charm, function, and flexibility, this home is ready for its next owner to enjoy.
Listing Agent
Berkshire Hathaway HomeServices Premier Properties Listed on: 10/09/2025

Home Details
Home Type
- Single Family
Est. Annual Taxes
- $4,007
Year Built
- Built in 1919
Lot Details
- 6,752 Sq Ft Lot
- Lot Dimensions are 48 x 140
- Property is Fully Fenced
- Corner Lot
Parking
- 3 Car Garage
Home Design
- Architectural Shingle Roof
- Steel Siding
Interior Spaces
- 2-Story Property
- Family Room
- Living Room
- Dining Room
- Utility Room
- Basement
Kitchen
- Range
- Dishwasher
- Disposal
Bedrooms and Bathrooms
- 4 Bedrooms
Laundry
- Laundry Room
- Dryer
- Washer
Utilities
- Forced Air Heating and Cooling System
Community Details
- No Home Owners Association
- Hectors Add Subdivision
Listing and Financial Details
- Assessor Parcel Number 01116000980000
Map
Home Values in the Area
Average Home Value in this Area
Tax History
| Year | Tax Paid | Tax Assessment Tax Assessment Total Assessment is a certain percentage of the fair market value that is determined by local assessors to be the total taxable value of land and additions on the property. | Land | Improvement |
|---|---|---|---|---|
| 2024 | $4,007 | $146,500 | $19,200 | $127,300 |
| 2023 | $4,036 | $129,650 | $19,200 | $110,450 |
| 2022 | $3,744 | $116,800 | $19,200 | $97,600 |
| 2021 | $3,404 | $106,200 | $19,200 | $87,000 |
| 2020 | $3,114 | $96,550 | $19,200 | $77,350 |
| 2019 | $3,116 | $96,550 | $11,400 | $85,150 |
| 2018 | $3,158 | $99,450 | $11,400 | $88,050 |
| 2017 | $3,008 | $94,700 | $11,400 | $83,300 |
| 2016 | $2,742 | $91,950 | $11,400 | $80,550 |
| 2015 | $2,533 | $77,900 | $7,800 | $70,100 |
| 2014 | $2,400 | $70,800 | $7,800 | $63,000 |
| 2013 | $2,341 | $68,750 | $7,800 | $60,950 |
Property History
| Date | Event | Price | List to Sale | Price per Sq Ft |
|---|---|---|---|---|
| 11/12/2025 11/12/25 | Pending | -- | -- | -- |
| 10/09/2025 10/09/25 | For Sale | $289,900 | -- | $149 / Sq Ft |
Purchase History
| Date | Type | Sale Price | Title Company |
|---|---|---|---|
| Warranty Deed | $178,000 | Title Co | |
| Warranty Deed | $169,900 | Us Title |
Mortgage History
| Date | Status | Loan Amount | Loan Type |
|---|---|---|---|
| Previous Owner | $134,900 | New Conventional |
Source: NorthstarMLS
MLS Number: 6796490
APN: 01-1160-00980-000
Disclaimer: Certain information contained herein is derived from information provided by parties other than Homes.com. All information provided is deemed reliable, but is not guaranteed to be accurate and should be independently verified.
![]() Based on information submitted to the MLS GRID. All data is obtained from various sources and may not have been verified by broker or MLS GRID. Supplied Open House Information is subject to change without notice. All information should be independently reviewed and verified for accuracy. Properties may or may not be listed by the office/agent presenting the information. Some IDX listings have been excluded from this website.
Based on information submitted to the MLS GRID. All data is obtained from various sources and may not have been verified by broker or MLS GRID. Supplied Open House Information is subject to change without notice. All information should be independently reviewed and verified for accuracy. Properties may or may not be listed by the office/agent presenting the information. Some IDX listings have been excluded from this website.
The Digital Millennium Copyright Act of 1998, 17 U.S.C. § 512 (the “DMCA”) provides recourse for copyright owners who believe that material appearing on the Internet infringes their rights under U.S. copyright law. If you believe in good faith that any content or material made available in connection with our website or services infringes your copyright, you (or your agent) may send us a notice requesting that the content or material be removed, or access to it blocked.
Notices must be sent in writing by email to DMCAnotice@MLSGrid.com.
The DMCA requires that your notice of alleged copyright infringement include the following information:
(1) description of the copyrighted work that is the subject of claimed infringement;
(2) description of the alleged infringing content and information sufficient to permit us to locate the content;
(3) contact information for you, including your address, telephone number and email address;
(4) a statement by you that you have a good faith belief that the content in the manner complained of is not authorized by the copyright owner, or its agent, or by the operation of any law;
(5) a statement by you, signed under penalty of perjury, that the information in the notification is accurate and that you have the authority to enforce the copyrights that are claimed to be infringed; and
(6) a physical or electronic signature of the copyright owner or a person authorized to act on the copyright owner’s behalf. Failure to include all of the above information may result in the delay of the processing of your complaint.