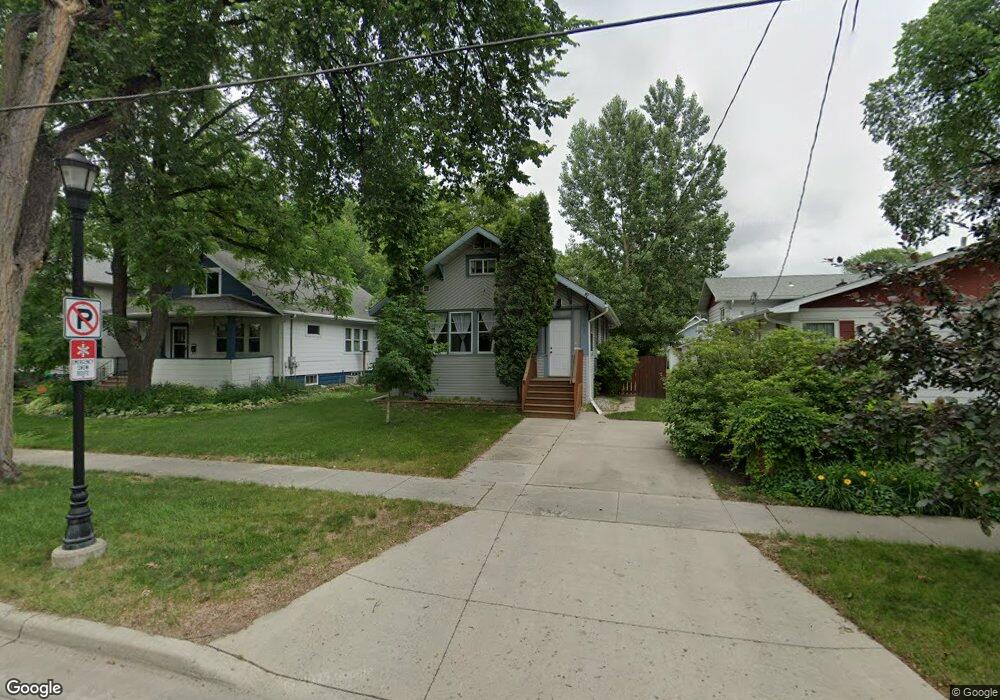
1103 4th St N Fargo, ND 58102
Horace Mann NeighborhoodEstimated Value: $215,000 - $233,000
3
Beds
2
Baths
816
Sq Ft
$276/Sq Ft
Est. Value
About This Home
This home is located at 1103 4th St N, Fargo, ND 58102 and is currently estimated at $225,156, approximately $275 per square foot. 1103 4th St N is a home located in Cass County with nearby schools including Horace Mann Roosevelt Elementary School, Ben Franklin Middle School, and North High School.
Ownership History
Date
Name
Owned For
Owner Type
Purchase Details
Closed on
Sep 16, 2009
Sold by
Us Bank Na
Bought by
Us Bank Na
Current Estimated Value
Purchase Details
Closed on
Aug 4, 2009
Sold by
Swanson Kurt and Swanson Steven K
Bought by
U S Bank Na and Wachovia Bank Na Pooling And Servicing
Purchase Details
Closed on
Sep 22, 2008
Sold by
Us Bank Na
Bought by
Vangstad Eric and Vangstad Jennifer
Home Financials for this Owner
Home Financials are based on the most recent Mortgage that was taken out on this home.
Original Mortgage
$102,116
Interest Rate
5.5%
Mortgage Type
FHA
Purchase Details
Closed on
May 16, 2005
Sold by
Swanson Steven K
Bought by
Swanson Kurt
Create a Home Valuation Report for This Property
The Home Valuation Report is an in-depth analysis detailing your home's value as well as a comparison with similar homes in the area
Home Values in the Area
Average Home Value in this Area
Purchase History
| Date | Buyer | Sale Price | Title Company |
|---|---|---|---|
| Us Bank Na | -- | -- | |
| U S Bank Na | $95,200 | -- | |
| Vangstad Eric | -- | -- | |
| Swanson Kurt | -- | -- |
Source: Public Records
Mortgage History
| Date | Status | Borrower | Loan Amount |
|---|---|---|---|
| Previous Owner | Vangstad Eric | $102,116 |
Source: Public Records
Tax History
| Year | Tax Paid | Tax Assessment Tax Assessment Total Assessment is a certain percentage of the fair market value that is determined by local assessors to be the total taxable value of land and additions on the property. | Land | Improvement |
|---|---|---|---|---|
| 2024 | $3,284 | $110,050 | $19,200 | $90,850 |
| 2023 | $3,430 | $97,400 | $19,200 | $78,200 |
| 2022 | $3,347 | $92,750 | $19,200 | $73,550 |
| 2021 | $3,076 | $84,300 | $19,200 | $65,100 |
| 2020 | $2,535 | $80,300 | $19,200 | $61,100 |
| 2019 | $2,537 | $80,300 | $11,400 | $68,900 |
| 2018 | $2,363 | $74,650 | $11,400 | $63,250 |
| 2017 | $2,251 | $71,100 | $11,400 | $59,700 |
| 2016 | $2,051 | $69,050 | $11,400 | $57,650 |
| 2015 | $1,633 | $63,650 | $7,800 | $55,850 |
| 2014 | $1,553 | $58,950 | $7,800 | $51,150 |
| 2013 | $1,482 | $56,150 | $7,800 | $48,350 |
Source: Public Records
Map
Nearby Homes
- 1125 5th St N
- 1119 Broadway N
- 921 4th St N
- 1120 Broadway N
- 1002 5th St N
- 1257 4th St N
- 915 Broadway N
- 1249 2nd St N
- 902-904 N 1st Street North St N
- 624 10th Ave N
- 1245 1st St N
- 628 10th Ave N
- 804 3rd St N
- 1119 9th St N
- 1345 4th St N
- 727 3rd St N
- 722 9th Ave N
- 1306 Elm St N
- 1109 10th St N
- 1045 10th St N
Your Personal Tour Guide
Ask me questions while you tour the home.