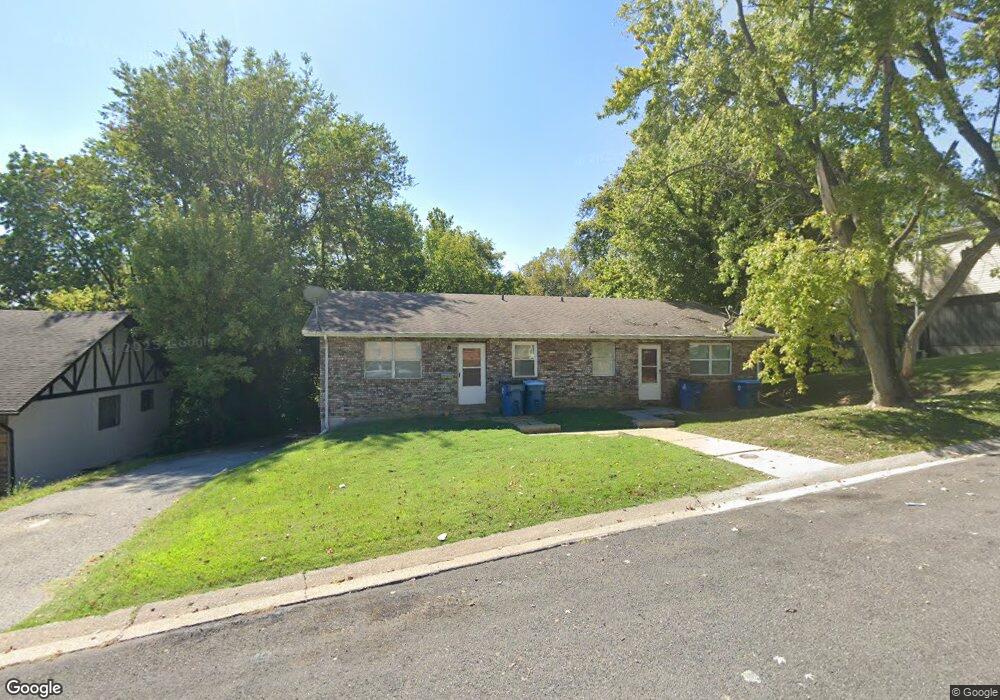
1103 Arrowhead Dr Unit A & B Collinsville, IL 62234
Estimated Value: $163,000 - $257,000
4
Beds
--
Bath
1,716
Sq Ft
$120/Sq Ft
Est. Value
About This Home
This home is located at 1103 Arrowhead Dr Unit A & B, Collinsville, IL 62234 and is currently estimated at $205,563, approximately $119 per square foot. 1103 Arrowhead Dr Unit A & B is a home located in St. Clair County with nearby schools including Twin Echo Elementary School, Dorris Intermediate School, and Collinsville Middle School.
Ownership History
Date
Name
Owned For
Owner Type
Purchase Details
Closed on
Oct 27, 2021
Sold by
Dhj Holdings Llc 1
Bought by
Dhj Holdings Llc Ii
Current Estimated Value
Purchase Details
Closed on
Jul 1, 2020
Sold by
Robins Larry J and Harmon Lisa Sue
Bought by
Dhj Holdings Llc 1
Home Financials for this Owner
Home Financials are based on the most recent Mortgage that was taken out on this home.
Original Mortgage
$85,000
Interest Rate
3.1%
Mortgage Type
Commercial
Purchase Details
Closed on
Dec 20, 2001
Sold by
Lewis Michael
Bought by
Robins Larry J and Robins Diann L
Home Financials for this Owner
Home Financials are based on the most recent Mortgage that was taken out on this home.
Original Mortgage
$65,265
Interest Rate
7.25%
Mortgage Type
Purchase Money Mortgage
Create a Home Valuation Report for This Property
The Home Valuation Report is an in-depth analysis detailing your home's value as well as a comparison with similar homes in the area
Home Values in the Area
Average Home Value in this Area
Purchase History
| Date | Buyer | Sale Price | Title Company |
|---|---|---|---|
| Dhj Holdings Llc Ii | -- | Abstracts And Title | |
| Dhj Holdings Llc 1 | $85,000 | Abstracts And Titles | |
| Robins Larry J | $88,000 | Abstracts & Titles Inc |
Source: Public Records
Mortgage History
| Date | Status | Borrower | Loan Amount |
|---|---|---|---|
| Previous Owner | Dhj Holdings Llc 1 | $85,000 | |
| Previous Owner | Robins Larry J | $65,265 |
Source: Public Records
Tax History Compared to Growth
Tax History
| Year | Tax Paid | Tax Assessment Tax Assessment Total Assessment is a certain percentage of the fair market value that is determined by local assessors to be the total taxable value of land and additions on the property. | Land | Improvement |
|---|---|---|---|---|
| 2024 | $3,324 | $49,623 | $3,371 | $46,252 |
| 2023 | $3,069 | $43,907 | $2,983 | $40,924 |
| 2022 | $2,976 | $42,773 | $2,924 | $39,849 |
| 2021 | $2,928 | $40,597 | $2,775 | $37,822 |
| 2020 | $2,881 | $38,455 | $2,628 | $35,827 |
| 2019 | $2,813 | $38,455 | $2,628 | $35,827 |
| 2018 | $2,834 | $38,555 | $3,943 | $34,612 |
| 2017 | $2,864 | $36,991 | $3,783 | $33,208 |
| 2016 | $2,916 | $36,156 | $3,698 | $32,458 |
| 2014 | $3,043 | $40,452 | $5,860 | $34,592 |
| 2013 | $3,190 | $41,198 | $5,968 | $35,230 |
Source: Public Records
Map
Nearby Homes
- 746 Maple St
- 1109 Saint Clair Ave
- Lot 20 Jefferson Ave
- 820 Bond Ave
- Lot 36 Jefferson Ave
- Lot 37 Jefferson Ave
- Lot 38 Jefferson Ave
- Lot 32 Jefferson Ave
- 128 Courtland Place
- 116 Moffett Ave
- 114 Moffett Ave Unit 116
- 125 S Hesperia St
- 208 Coral Dr
- 121 S Seminary St
- 611 W Main St
- 8038 Tahoe Ridge
- 710 Saint Louis Rd
- 110 E Church St
- 202 Keeneland Ct
- 8026 Tahoe Ridge
- 1103 Arrowhead Dr
- 1105 Arrowhead Dr
- 1101 Arrowhead Dr Unit A-D
- 1101 Arrowhead Dr
- 1102 Apache Dr
- 1003 Cherokee St
- 1003 Cherokee St Unit C
- 1107 Arrowhead Dr
- 1104 Apache Dr
- 1102 Arrowhead Dr
- 1100 Apache Dr
- 1104 Arrowhead Dr
- 1106 Apache Dr
- 1100 Arrowhead Dr
- 1002 Cherokee St Unit 1-4
- 1002 Cherokee St Unit A
- 1002 Cherokee St Unit D
- 1002 Cherokee St
- 1109 Arrowhead Dr
- 1106 Arrowhead Dr