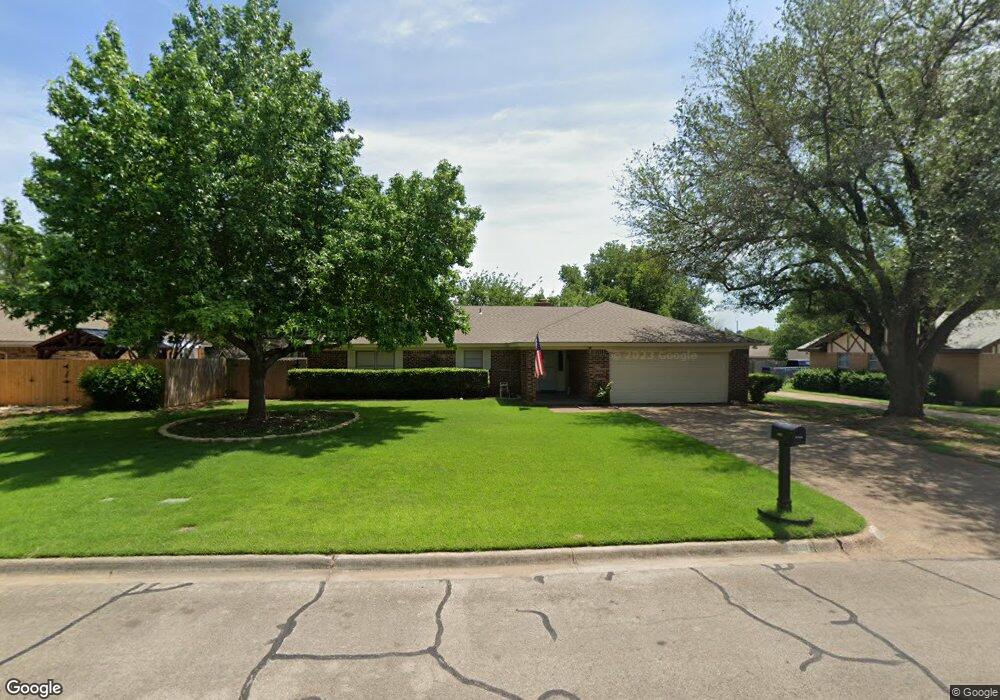
1103 Belmont Rd Cleburne, TX 76033
Estimated Value: $274,730 - $300,000
3
Beds
2
Baths
1,777
Sq Ft
$162/Sq Ft
Est. Value
About This Home
This home is located at 1103 Belmont Rd, Cleburne, TX 76033 and is currently estimated at $287,933, approximately $162 per square foot. 1103 Belmont Rd is a home located in Johnson County with nearby schools including Coleman Elementary School, Lowell Smith Jr. Middle School, and Cleburne High School.
Ownership History
Date
Name
Owned For
Owner Type
Purchase Details
Closed on
Sep 26, 2017
Sold by
D & D Tri Angle Investments Llc
Bought by
Weaver Jordan Michael and Weaver Jessie Lynn
Current Estimated Value
Home Financials for this Owner
Home Financials are based on the most recent Mortgage that was taken out on this home.
Original Mortgage
$175,800
Outstanding Balance
$147,117
Interest Rate
3.89%
Mortgage Type
VA
Estimated Equity
$140,816
Purchase Details
Closed on
May 31, 2005
Sold by
Jpmorgan Chase Bank Na
Bought by
Cruz Maximo Adan
Home Financials for this Owner
Home Financials are based on the most recent Mortgage that was taken out on this home.
Original Mortgage
$77,600
Interest Rate
5.83%
Mortgage Type
New Conventional
Create a Home Valuation Report for This Property
The Home Valuation Report is an in-depth analysis detailing your home's value as well as a comparison with similar homes in the area
Home Values in the Area
Average Home Value in this Area
Purchase History
| Date | Buyer | Sale Price | Title Company |
|---|---|---|---|
| Weaver Jordan Michael | -- | None Available | |
| Cruz Maximo Adan | -- | None Available |
Source: Public Records
Mortgage History
| Date | Status | Borrower | Loan Amount |
|---|---|---|---|
| Open | Weaver Jordan Michael | $175,800 | |
| Previous Owner | Cruz Maximo Adan | $77,600 |
Source: Public Records
Tax History Compared to Growth
Tax History
| Year | Tax Paid | Tax Assessment Tax Assessment Total Assessment is a certain percentage of the fair market value that is determined by local assessors to be the total taxable value of land and additions on the property. | Land | Improvement |
|---|---|---|---|---|
| 2025 | $3,491 | $272,422 | $65,000 | $207,422 |
| 2024 | $5,108 | $229,112 | $0 | $0 |
| 2023 | $3,051 | $272,422 | $65,000 | $207,422 |
| 2022 | $4,739 | $229,819 | $55,000 | $174,819 |
| 2021 | $4,491 | $204,127 | $45,000 | $159,127 |
| 2020 | $4,336 | $156,486 | $30,000 | $126,486 |
| 2019 | $4,624 | $156,488 | $30,000 | $126,488 |
| 2018 | $4,626 | $156,488 | $30,000 | $126,488 |
| 2017 | $4,413 | $149,906 | $25,000 | $124,906 |
| 2016 | $4,074 | $138,407 | $25,000 | $113,407 |
| 2015 | $3,113 | $138,407 | $25,000 | $113,407 |
| 2014 | $3,113 | $116,788 | $25,000 | $91,788 |
Source: Public Records
Map
Nearby Homes
- 1115 Green River Trail
- 840 S Ridgeway Dr
- 4112 Highland Dr
- 4101 Highland Dr
- 909 Highland Dr
- 1208 Cindy Ln
- 1116 Willowcreek Rd
- 1211 Greenbriar Ln
- 1103 Trace Rd
- 1104 Cherrywood Dr
- 1104 Lynnwood Dr
- 1204 W Westhill Dr
- 1302 Cindy Ct
- 1304 Bradley Ct
- 1307 Bradley Ct
- 1327 Hemphill Dr
- 1225 Crestwood Dr
- 616 Bellevue Dr
- 806 S Colonial Dr
- 1027 Spring Azure Dr
- 1105 Belmont Rd
- 1008 Berkley Dr
- 1100 Berkley Dr
- 1107 Belmont Rd
- 1102 Belmont Rd
- 1104 Belmont Rd
- 1006 Berkley Dr
- 1005 Canton Rd
- 1104 Berkley Dr
- 1121 Green River Trail
- 1109 Belmont Rd
- 1101 Berkley Dr
- 1013 Berkley Dr
- 1119 Green River Trail
- 1106 Berkley Dr
- 1007 Canton Rd
- 1105 Berkley Ct
- 1103 Berkley Ct
- 1011 Berkley Dr
- 1111 Belmont Rd