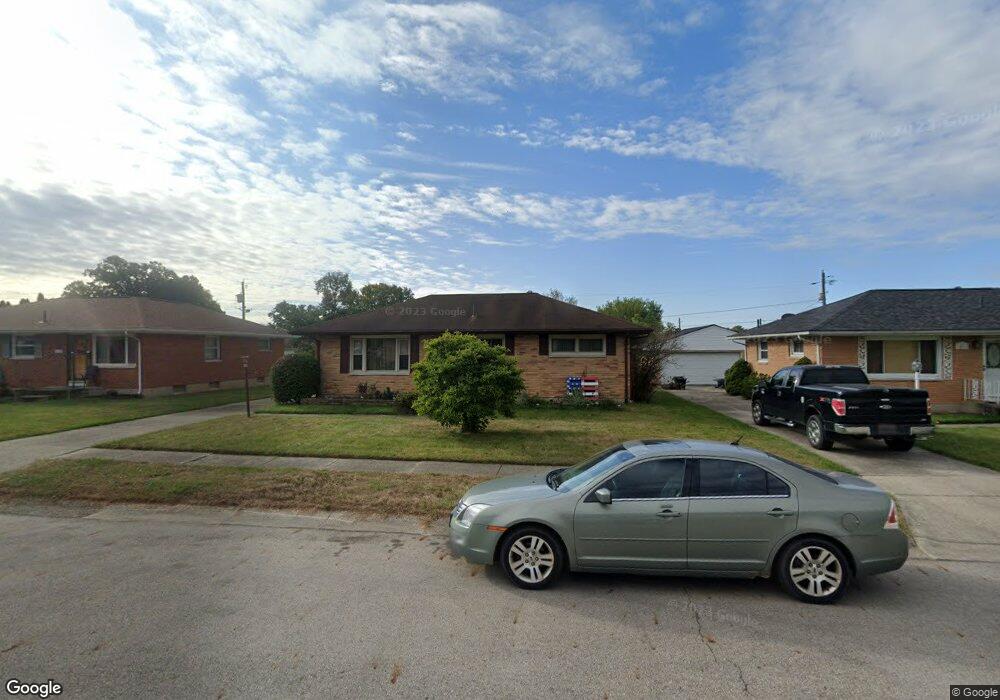
1103 Blaine Ave Springfield, OH 45503
Estimated Value: $196,999 - $221,000
3
Beds
2
Baths
1,193
Sq Ft
$172/Sq Ft
Est. Value
About This Home
This home is located at 1103 Blaine Ave, Springfield, OH 45503 and is currently estimated at $205,500, approximately $172 per square foot. 1103 Blaine Ave is a home located in Clark County with nearby schools including Northridge Elementary School, Kenton Ridge Middle & High School, and Emmanuel Christian Academy.
Ownership History
Date
Name
Owned For
Owner Type
Purchase Details
Closed on
Apr 7, 2014
Sold by
Northern Brian K
Bought by
Northern Shauna L
Current Estimated Value
Home Financials for this Owner
Home Financials are based on the most recent Mortgage that was taken out on this home.
Original Mortgage
$75,500
Outstanding Balance
$56,823
Interest Rate
4.31%
Mortgage Type
New Conventional
Estimated Equity
$148,677
Purchase Details
Closed on
Sep 15, 2004
Sold by
White James B and White Jennifer R
Bought by
Northern Brian K and Northern Shauna L
Home Financials for this Owner
Home Financials are based on the most recent Mortgage that was taken out on this home.
Original Mortgage
$93,300
Interest Rate
6.08%
Mortgage Type
Purchase Money Mortgage
Purchase Details
Closed on
Mar 26, 1999
Sold by
Getz Ronald E and Getz Mary A
Bought by
White James B and Estep Jennifer R
Home Financials for this Owner
Home Financials are based on the most recent Mortgage that was taken out on this home.
Original Mortgage
$94,951
Interest Rate
6.94%
Mortgage Type
FHA
Create a Home Valuation Report for This Property
The Home Valuation Report is an in-depth analysis detailing your home's value as well as a comparison with similar homes in the area
Home Values in the Area
Average Home Value in this Area
Purchase History
| Date | Buyer | Sale Price | Title Company |
|---|---|---|---|
| Northern Shauna L | -- | Attorney | |
| Northern Brian K | $116,800 | -- | |
| White James B | $95,000 | Ati Title Agency Of Ohio Inc |
Source: Public Records
Mortgage History
| Date | Status | Borrower | Loan Amount |
|---|---|---|---|
| Open | Northern Shauna L | $75,500 | |
| Closed | Northern Brian K | $93,300 | |
| Closed | White James B | $94,951 |
Source: Public Records
Tax History
| Year | Tax Paid | Tax Assessment Tax Assessment Total Assessment is a certain percentage of the fair market value that is determined by local assessors to be the total taxable value of land and additions on the property. | Land | Improvement |
|---|---|---|---|---|
| 2025 | $2,227 | $63,290 | $16,460 | $46,830 |
| 2024 | $2,154 | $50,870 | $9,580 | $41,290 |
| 2023 | $2,154 | $50,870 | $9,580 | $41,290 |
| 2022 | $2,162 | $50,870 | $9,580 | $41,290 |
| 2021 | $1,833 | $36,580 | $7,100 | $29,480 |
| 2020 | $1,834 | $36,580 | $7,100 | $29,480 |
| 2019 | $1,869 | $36,580 | $7,100 | $29,480 |
| 2018 | $1,749 | $32,860 | $9,040 | $23,820 |
| 2017 | $1,499 | $32,585 | $9,044 | $23,541 |
| 2016 | $1,488 | $32,585 | $9,044 | $23,541 |
| 2015 | $1,576 | $32,239 | $8,698 | $23,541 |
| 2014 | $1,576 | $32,239 | $8,698 | $23,541 |
| 2013 | $1,539 | $32,239 | $8,698 | $23,541 |
Source: Public Records
Map
Nearby Homes
- 4733 Curtis Dr
- 4741 Cullen Ave
- 4802 Willowbrook Dr
- 1341 Student Ave
- 4322 Midfield St Unit 15
- 4256 Midfield St Unit 9
- 4446 Ridgewood Rd E Unit 3
- 4577 Reno Ln Unit 2
- 4652 Reno Ln Unit 15
- 5033 Ridgewood Rd E
- 1162 Kingsgate Rd
- 1644 Delmar Dr
- 3942 Harris Ln
- 5235 W Ridgewood Rd
- 5300 Brookshire Ln
- 1201 Kingsgate Rd
- 4732 Lehigh Dr
- 1521 Erika Dr
- 1500 Kingsgate Rd Unit 19430
- 1502 Kingsgate Rd Unit 19432
- 1109 Blaine Ave
- 1061 Blaine Ave
- 1102 Cheyenne Ave
- 1115 Blaine Ave
- 1108 Cheyenne Ave
- 1060 Cheyenne Ave
- 1104 Blithe Rd
- 1056 Cheyenne Ave
- 1056 Cheyenne Ave
- 1056 Cheyenne Ave
- 1116 Cheyenne Ave
- 1060 Blaine Ave
- 1121 Blaine Ave
- 1052 Cheyenne Ave Unit 1052
- 1050 Cheyenne Ave Unit 1050
- 1050 Cheyenne Ave
- 1120 Cheyenne Ave
- 1048 Cheyenne Ave Unit 1048
- 1048 Cheyenne Ave
- 1120 Blaine Ave
Your Personal Tour Guide
Ask me questions while you tour the home.