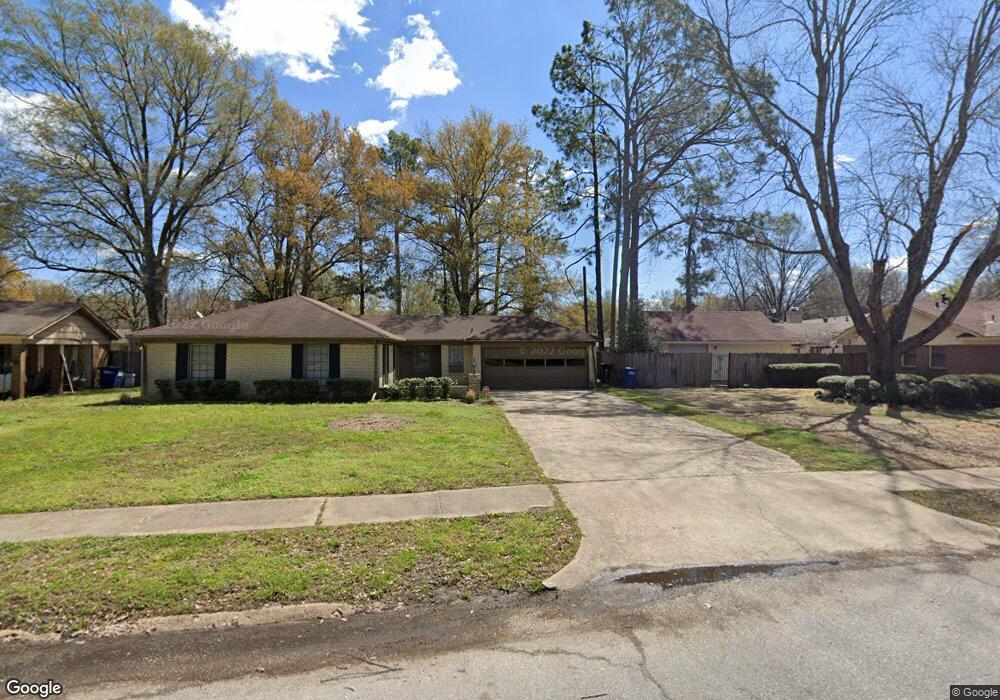
1103 Bridgeport Dr West Memphis, AR 72301
Estimated Value: $192,000 - $223,000
3
Beds
2
Baths
1,520
Sq Ft
$134/Sq Ft
Est. Value
About This Home
This home is located at 1103 Bridgeport Dr, West Memphis, AR 72301 and is currently estimated at $203,603, approximately $133 per square foot. 1103 Bridgeport Dr is a home located in Crittenden County with nearby schools including Richland Elementary School, West Junior High School, and The Academies of West Memphis Charter School.
Ownership History
Date
Name
Owned For
Owner Type
Purchase Details
Closed on
Aug 31, 2023
Sold by
Rodgers Ethel L and Rodgers Jafus B
Bought by
Bailey Dawn
Current Estimated Value
Purchase Details
Closed on
Oct 11, 2019
Sold by
Wheeless Katherine M and Butler Katherine
Bought by
Rodgers Ethel L
Home Financials for this Owner
Home Financials are based on the most recent Mortgage that was taken out on this home.
Original Mortgage
$142,000
Interest Rate
3.5%
Mortgage Type
VA
Purchase Details
Closed on
Dec 11, 2015
Bought by
Perry Evondar
Purchase Details
Closed on
Mar 3, 2008
Sold by
Poskey Edward Lee
Bought by
Perry Steve A
Purchase Details
Closed on
Mar 20, 2006
Sold by
Wheeless Charles E
Bought by
Wheeless Katherine M
Purchase Details
Closed on
Jun 1, 1987
Bought by
Wheeless Chas E and Wheeless Katherine
Purchase Details
Closed on
Jan 1, 1978
Bought by
To
Create a Home Valuation Report for This Property
The Home Valuation Report is an in-depth analysis detailing your home's value as well as a comparison with similar homes in the area
Home Values in the Area
Average Home Value in this Area
Purchase History
| Date | Buyer | Sale Price | Title Company |
|---|---|---|---|
| Bailey Dawn | $57,500 | None Listed On Document | |
| Rodgers Ethel L | $142,000 | Stewart Title | |
| Perry Evondar | -- | -- | |
| Perry Steve A | -- | -- | |
| Wheeless Katherine M | -- | -- | |
| Wheeless Chas E | $72,000 | -- | |
| To | $44,000 | -- |
Source: Public Records
Mortgage History
| Date | Status | Borrower | Loan Amount |
|---|---|---|---|
| Previous Owner | Rodgers Ethel L | $142,000 |
Source: Public Records
Tax History Compared to Growth
Tax History
| Year | Tax Paid | Tax Assessment Tax Assessment Total Assessment is a certain percentage of the fair market value that is determined by local assessors to be the total taxable value of land and additions on the property. | Land | Improvement |
|---|---|---|---|---|
| 2024 | $770 | $26,420 | $4,800 | $21,620 |
| 2023 | $845 | $26,420 | $4,800 | $21,620 |
| 2022 | $895 | $26,420 | $4,800 | $21,620 |
| 2021 | $895 | $26,420 | $4,800 | $21,620 |
| 2020 | $1,197 | $26,420 | $4,800 | $21,620 |
| 2019 | $852 | $22,540 | $4,600 | $17,940 |
| 2018 | $916 | $22,540 | $4,600 | $17,940 |
| 2017 | $916 | $0 | $0 | $0 |
| 2016 | $861 | $22,540 | $4,600 | $17,940 |
| 2015 | $575 | $22,540 | $4,600 | $17,940 |
| 2014 | $671 | $24,900 | $4,800 | $20,100 |
Source: Public Records
Map
Nearby Homes
- 1105 Cherry Ln
- 1102 Bridgeport Dr
- 808 Dover Rd
- 906 N Roselawn Dr
- 813 Pryor Dr
- 910 Richland Dr
- 817 Dover Rd
- 1113 Spears St
- 1301 Crestmere St
- 823 S Roselawn Dr
- 1010 Richland Dr
- 613 Dover Rd
- 603 Highland Dr
- 1203 W Roselawn Dr
- 909 Rosewood Dr
- 807 W Barton Ave
- 1042 W Roselawn Dr
- 1017 Mayberry Cove
- 519 S Roselawn Dr
- 1012 Clement Rd
- 1103 Bridgeport St
- 1105 Bridgeport St
- 1101 Bridgeport St
- 809 Arlington Dr
- 1107 Bridgeport St
- 1108 Cherry Ln
- 1102 Bridgeport St
- 1106 Cherry Ln
- 1110 Cherry Ln
- 1100 Bridgeport St
- 1100 Bridgeport Dr
- 1104 Bridgeport St
- 1104 Cherry Ln
- 1112 Cherry Ln
- 814 Arlington Dr
- 1106 Bridgeport St
- 812 Arlington Dr
- 1106 Bridgeport Dr
- 816 Arlington Dr
- 1109 Bridgeport St