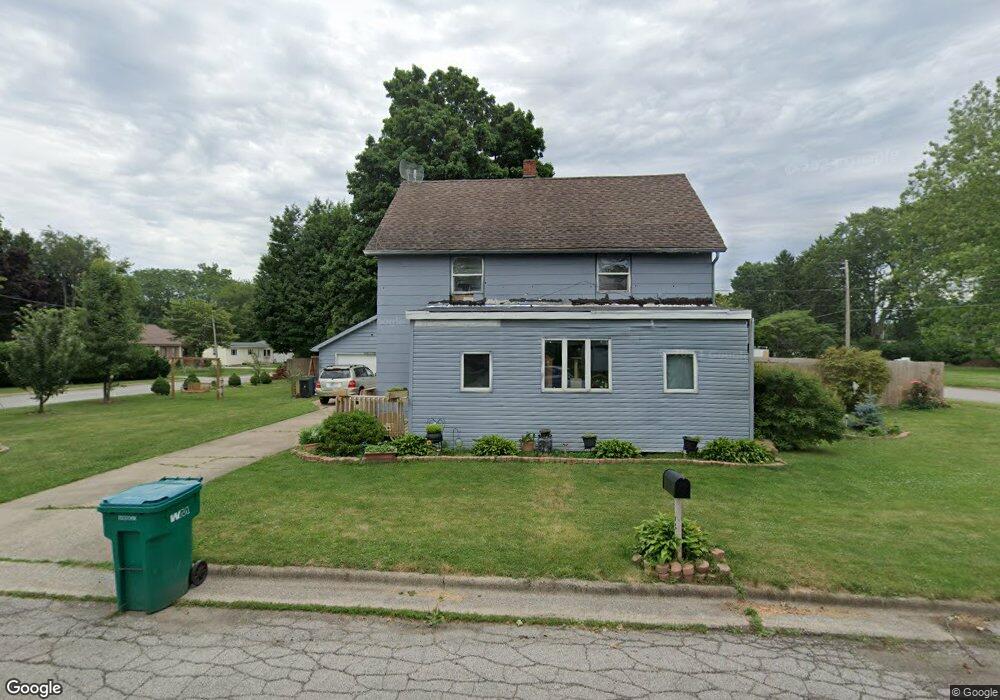
1103 C St La Porte, IN 46350
Estimated Value: $166,000 - $223,000
3
Beds
2
Baths
1,708
Sq Ft
$110/Sq Ft
Est. Value
About This Home
This home is located at 1103 C St, La Porte, IN 46350 and is currently estimated at $188,207, approximately $110 per square foot. 1103 C St is a home located in LaPorte County with nearby schools including Dunkerton Elementary School, Handley Elementary School, and La Porte High School.
Ownership History
Date
Name
Owned For
Owner Type
Purchase Details
Closed on
Dec 29, 2014
Sold by
Henry Robert
Bought by
Henry Ralph
Current Estimated Value
Purchase Details
Closed on
Jun 5, 2012
Sold by
Henry Ralph and Henry Christina
Bought by
Henry Robert
Purchase Details
Closed on
May 26, 2011
Sold by
Secretary Of Housing & Urban Development
Bought by
Henry Ralph and Henry Cristina
Purchase Details
Closed on
Dec 3, 2010
Sold by
U S Bank Na
Bought by
The Secretary Of Housing & Urban Develop
Purchase Details
Closed on
Nov 18, 2010
Sold by
Smith Chasity D and Hagenow Jason D
Bought by
U S Bank Na
Purchase Details
Closed on
Mar 27, 2008
Sold by
Moore William H
Bought by
Smith Chasity D and Hightower Chasity D
Create a Home Valuation Report for This Property
The Home Valuation Report is an in-depth analysis detailing your home's value as well as a comparison with similar homes in the area
Home Values in the Area
Average Home Value in this Area
Purchase History
| Date | Buyer | Sale Price | Title Company |
|---|---|---|---|
| Henry Ralph | -- | None Available | |
| Henry Robert | -- | None Available | |
| Henry Ralph | -- | None Available | |
| The Secretary Of Housing & Urban Develop | $70,286 | None Available | |
| U S Bank Na | $87,700 | None Available | |
| Smith Chasity D | -- | None Available |
Source: Public Records
Tax History Compared to Growth
Tax History
| Year | Tax Paid | Tax Assessment Tax Assessment Total Assessment is a certain percentage of the fair market value that is determined by local assessors to be the total taxable value of land and additions on the property. | Land | Improvement |
|---|---|---|---|---|
| 2024 | $1,376 | $104,900 | $25,300 | $79,600 |
| 2022 | $1,037 | $103,700 | $21,100 | $82,600 |
| 2021 | $973 | $97,300 | $21,100 | $76,200 |
| 2020 | $1,096 | $97,300 | $21,100 | $76,200 |
| 2019 | $1,144 | $109,600 | $25,700 | $83,900 |
| 2018 | $1,046 | $99,800 | $22,600 | $77,200 |
| 2017 | $1,000 | $95,200 | $22,600 | $72,600 |
| 2016 | $1,095 | $104,700 | $28,200 | $76,500 |
| 2014 | $960 | $96,000 | $28,200 | $67,800 |
Source: Public Records
Map
Nearby Homes