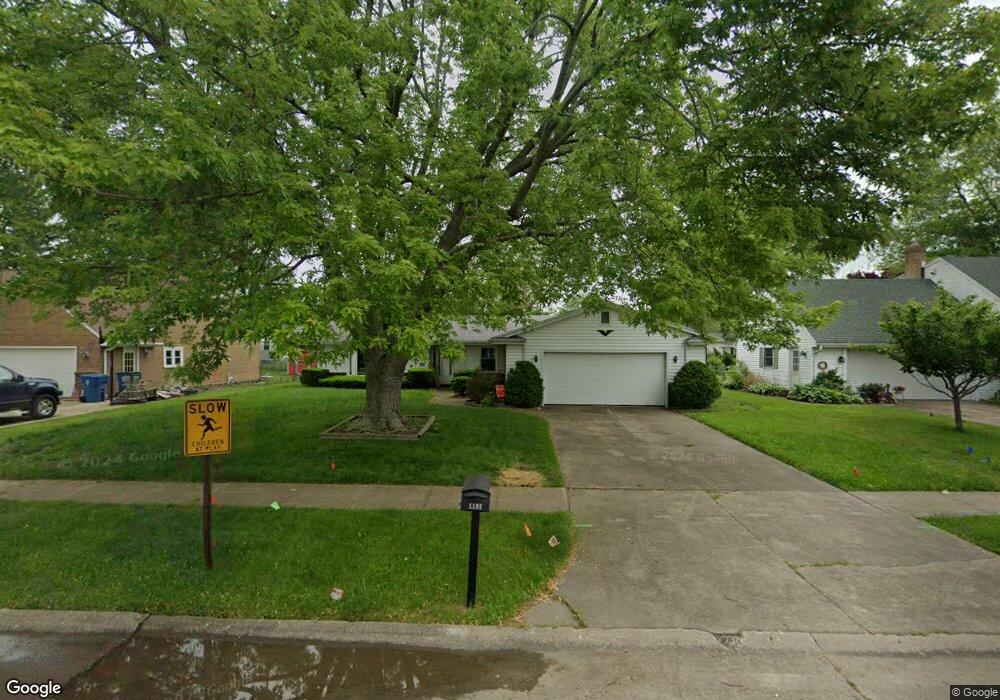
1103 Grant St Port Clinton, OH 43452
Estimated Value: $258,427 - $291,000
3
Beds
2
Baths
1,686
Sq Ft
$163/Sq Ft
Est. Value
About This Home
This home is located at 1103 Grant St, Port Clinton, OH 43452 and is currently estimated at $274,857, approximately $163 per square foot. 1103 Grant St is a home located in Ottawa County with nearby schools including Bataan Memorial Primary School, Bataan Memorial Intermediate School, and Port Clinton Middle School.
Ownership History
Date
Name
Owned For
Owner Type
Purchase Details
Closed on
Apr 17, 2009
Sold by
Steindam Richard L and Steindam Constance
Bought by
Crawford Jack M
Current Estimated Value
Home Financials for this Owner
Home Financials are based on the most recent Mortgage that was taken out on this home.
Original Mortgage
$48,331
Outstanding Balance
$30,733
Interest Rate
5.05%
Mortgage Type
FHA
Estimated Equity
$244,124
Purchase Details
Closed on
Apr 16, 2009
Sold by
Steindam Gerald B and Fatiga Darlene M
Bought by
Crawford Jack M
Home Financials for this Owner
Home Financials are based on the most recent Mortgage that was taken out on this home.
Original Mortgage
$48,331
Outstanding Balance
$30,733
Interest Rate
5.05%
Mortgage Type
FHA
Estimated Equity
$244,124
Create a Home Valuation Report for This Property
The Home Valuation Report is an in-depth analysis detailing your home's value as well as a comparison with similar homes in the area
Home Values in the Area
Average Home Value in this Area
Purchase History
| Date | Buyer | Sale Price | Title Company |
|---|---|---|---|
| Crawford Jack M | $85,900 | Southern Title Of Ohio Ltd | |
| Crawford Jack M | $28,600 | Southern Title Of Ohio Ltd |
Source: Public Records
Mortgage History
| Date | Status | Borrower | Loan Amount |
|---|---|---|---|
| Open | Crawford Jack M | $48,331 |
Source: Public Records
Tax History Compared to Growth
Tax History
| Year | Tax Paid | Tax Assessment Tax Assessment Total Assessment is a certain percentage of the fair market value that is determined by local assessors to be the total taxable value of land and additions on the property. | Land | Improvement |
|---|---|---|---|---|
| 2024 | $2,358 | $77,865 | $17,570 | $60,295 |
| 2023 | $2,358 | $56,378 | $11,718 | $44,660 |
| 2022 | $1,847 | $56,378 | $11,718 | $44,660 |
| 2021 | $936 | $32,900 | $11,720 | $21,180 |
| 2020 | $1,433 | $28,260 | $9,010 | $19,250 |
| 2019 | $1,418 | $47,480 | $9,010 | $38,470 |
| 2018 | $1,416 | $47,480 | $9,010 | $38,470 |
| 2017 | $1,244 | $42,240 | $9,010 | $33,230 |
| 2016 | $1,247 | $42,240 | $9,010 | $33,230 |
| 2015 | $1,251 | $42,240 | $9,010 | $33,230 |
| 2014 | $546 | $37,710 | $9,010 | $28,700 |
| 2013 | $1,094 | $37,710 | $9,010 | $28,700 |
Source: Public Records
Map
Nearby Homes
- 611 Alice St
- 1329 S West Bay Dr
- 1254 W Fremont Rd
- 807 Harrison St
- 111 E 10th St
- 900 S Madison St
- 229 W 4th St
- 413 W 3rd St
- 424 Monroe St
- 123 E 10th St
- 118 E 5th St
- 516 Jefferson St
- 2621 N Peachtree Lane # Sublot 1
- 2453 N Peachtree Lane # Sublot 7
- 2481 N Peachtree Lane # Sublot 6
- 2565 N Peachtree Lane # Sublot 3
- 0 Mouse Island Unit 20252634
- 2369 N Peachtree Lane # Sublot 10
- 2397 N Peachtree Lane # Sublot 9
- 2509 N Peachtree Lane # Sublot 5