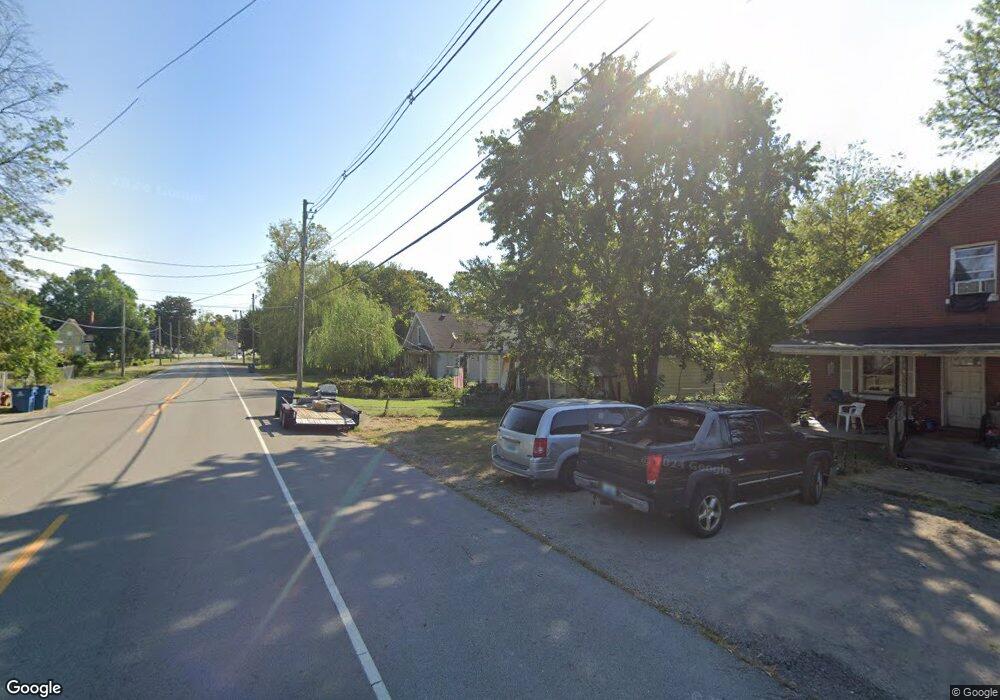
1103 Main St West Point, KY 40177
Estimated Value: $69,003 - $120,000
3
Beds
1
Bath
1,649
Sq Ft
$57/Sq Ft
Est. Value
About This Home
This home is located at 1103 Main St, West Point, KY 40177 and is currently estimated at $94,751, approximately $57 per square foot. 1103 Main St is a home located in Hardin County with nearby schools including West Point Elementary School, Nichols Elementary School, and Bullitt Lick Middle School.
Ownership History
Date
Name
Owned For
Owner Type
Purchase Details
Closed on
Aug 19, 2009
Sold by
Deutsche Bank National Trust Company
Bought by
Godden Linda M
Current Estimated Value
Home Financials for this Owner
Home Financials are based on the most recent Mortgage that was taken out on this home.
Original Mortgage
$24,804
Interest Rate
5.19%
Mortgage Type
Purchase Money Mortgage
Purchase Details
Closed on
Feb 9, 2009
Sold by
Nash Melissa Carol
Bought by
Deutsche Bank National Trust Company
Purchase Details
Closed on
May 17, 2005
Sold by
Moore Fran and Short Joseph
Bought by
Nash Melissa Carol
Home Financials for this Owner
Home Financials are based on the most recent Mortgage that was taken out on this home.
Original Mortgage
$63,750
Interest Rate
9.5%
Mortgage Type
Adjustable Rate Mortgage/ARM
Create a Home Valuation Report for This Property
The Home Valuation Report is an in-depth analysis detailing your home's value as well as a comparison with similar homes in the area
Purchase History
| Date | Buyer | Sale Price | Title Company |
|---|---|---|---|
| Godden Linda M | $30,000 | None Available | |
| Deutsche Bank National Trust Company | $84,916 | None Available | |
| Nash Melissa Carol | $75,000 | None Available |
Source: Public Records
Mortgage History
| Date | Status | Borrower | Loan Amount |
|---|---|---|---|
| Closed | Godden Linda M | $24,804 | |
| Previous Owner | Nash Melissa Carol | $63,750 |
Source: Public Records
Tax History
| Year | Tax Paid | Tax Assessment Tax Assessment Total Assessment is a certain percentage of the fair market value that is determined by local assessors to be the total taxable value of land and additions on the property. | Land | Improvement |
|---|---|---|---|---|
| 2025 | $441 | $31,900 | $6,500 | $25,400 |
| 2024 | $438 | $31,900 | $6,500 | $25,400 |
| 2023 | $405 | $31,900 | $6,500 | $25,400 |
| 2022 | $458 | $31,900 | $6,500 | $25,400 |
| 2021 | $423 | $31,900 | $6,500 | $25,400 |
| 2020 | $258 | $31,900 | $6,500 | $25,400 |
| 2019 | $0 | $31,900 | $0 | $0 |
| 2018 | $561 | $31,900 | $0 | $0 |
| 2017 | $526 | $30,000 | $0 | $0 |
| 2016 | $0 | $30,000 | $0 | $0 |
| 2015 | $518 | $30,000 | $0 | $0 |
| 2012 | -- | $30,000 | $0 | $0 |
Source: Public Records
Map
Nearby Homes
- 409 Elm St
- 11330 Lambs Ridge Rd SE
- 0 Rosewood Rd SE
- 10055 Old Highway 111 SE
- 7013 Shipley Ln
- 6918 Bowen Ave
- 14019 Darwin Blvd
- 7213 Rainbow Dr
- 7112 Dunkirk Ln
- 7414 Dunkirk Ln
- 7307 Nathan Hale Way
- 13507 Tennis Blvd
- 7101 Betsy Ross Dr
- 7301 Watson Ln
- 7209 Watson Ln
- 7408 Wimstock Ave
- 13422 Hopedale Way
- 13405 Lidcomb Ave
- 7207 Ethan Allen Way
- 6910 John Adams Way
Your Personal Tour Guide
Ask me questions while you tour the home.