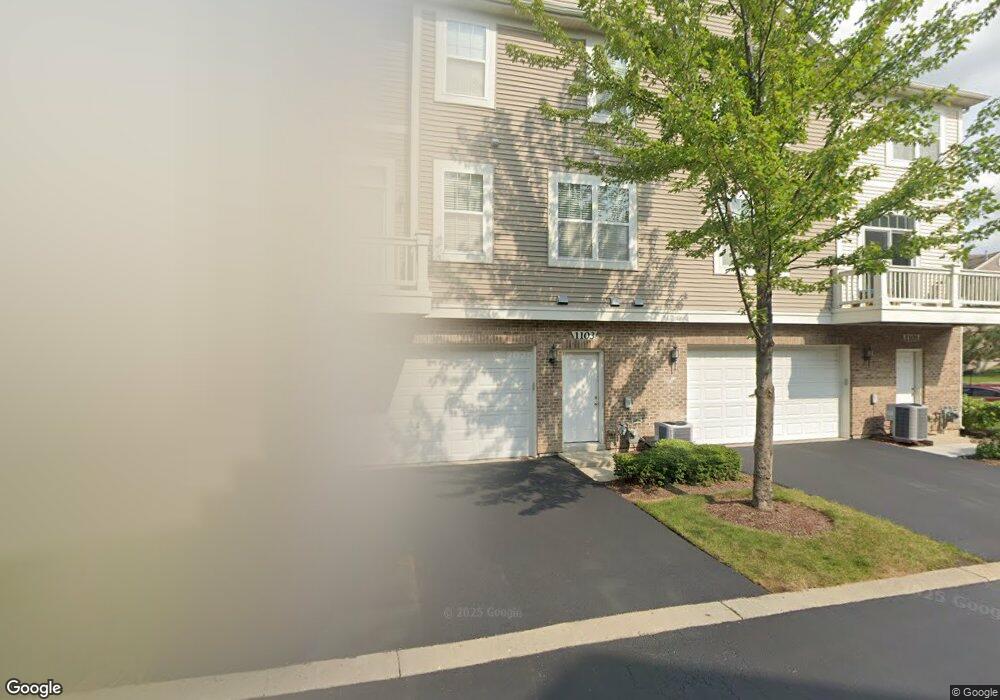
1103 Maubert Ct Unit 14-2 Carol Stream, IL 60188
Estimated Value: $387,674 - $398,000
2
Beds
3
Baths
1,772
Sq Ft
$222/Sq Ft
Est. Value
About This Home
This home is located at 1103 Maubert Ct Unit 14-2, Carol Stream, IL 60188 and is currently estimated at $394,169, approximately $222 per square foot. 1103 Maubert Ct Unit 14-2 is a home located in DuPage County with nearby schools including Cloverdale Elementary School, Stratford Middle School, and Glenbard North High School.
Ownership History
Date
Name
Owned For
Owner Type
Purchase Details
Closed on
Mar 4, 2009
Sold by
Bank Of America National Association
Bought by
Nitti Angela S
Current Estimated Value
Home Financials for this Owner
Home Financials are based on the most recent Mortgage that was taken out on this home.
Original Mortgage
$206,196
Interest Rate
4.9%
Mortgage Type
FHA
Purchase Details
Closed on
Oct 28, 2008
Sold by
Manzanilla Jose
Bought by
Lasalle Bank Na
Purchase Details
Closed on
Nov 15, 2006
Sold by
Pinnacle Corp
Bought by
Manzanilla Josei and Garcia Olivia
Home Financials for this Owner
Home Financials are based on the most recent Mortgage that was taken out on this home.
Original Mortgage
$58,144
Interest Rate
6.4%
Mortgage Type
Stand Alone Second
Create a Home Valuation Report for This Property
The Home Valuation Report is an in-depth analysis detailing your home's value as well as a comparison with similar homes in the area
Home Values in the Area
Average Home Value in this Area
Purchase History
| Date | Buyer | Sale Price | Title Company |
|---|---|---|---|
| Nitti Angela S | $210,000 | None Available | |
| Lasalle Bank Na | -- | None Available | |
| Manzanilla Josei | $291,000 | C T I C Dupage |
Source: Public Records
Mortgage History
| Date | Status | Borrower | Loan Amount |
|---|---|---|---|
| Previous Owner | Nitti Angela S | $206,196 | |
| Previous Owner | Manzanilla Josei | $58,144 |
Source: Public Records
Tax History Compared to Growth
Tax History
| Year | Tax Paid | Tax Assessment Tax Assessment Total Assessment is a certain percentage of the fair market value that is determined by local assessors to be the total taxable value of land and additions on the property. | Land | Improvement |
|---|---|---|---|---|
| 2024 | $8,879 | $111,493 | $16,752 | $94,741 |
| 2023 | $8,395 | $101,960 | $15,320 | $86,640 |
| 2022 | $7,307 | $85,210 | $15,220 | $69,990 |
| 2021 | $6,963 | $80,960 | $14,460 | $66,500 |
| 2020 | $6,847 | $78,990 | $14,110 | $64,880 |
| 2019 | $7,066 | $81,040 | $13,560 | $67,480 |
| 2018 | $6,673 | $77,830 | $13,210 | $64,620 |
| 2017 | $6,302 | $72,130 | $12,240 | $59,890 |
| 2016 | $5,961 | $66,760 | $11,330 | $55,430 |
| 2015 | $5,818 | $62,300 | $10,570 | $51,730 |
| 2014 | $4,963 | $53,150 | $9,520 | $43,630 |
| 2013 | $4,997 | $54,970 | $9,850 | $45,120 |
Source: Public Records
Map
Nearby Homes
- 1090 Maubert Ct
- 1161 Orangery Ct
- 951 Dearborn Cir
- 242 Klein Creek Ct Unit 1A
- 244 Klein Creek Ct Unit 3
- 342 Klein Creek Ct Unit 342A
- 113 W Elk Trail Unit 313
- 125 W Elk Trail Unit 124
- 129 W Elk Trail Unit 329
- 388 Canyon Trail
- 385 Wexford Ct Unit 32
- 413 Canyon Trail
- 790 Daybreak Ln Unit 217
- 877 Malibu Ct
- 784 N Gary Ave Unit 212
- 475 W Army Trail Rd
- 262 Allegro Ln Unit 257
- 1168 Chalet Dr
- 000 Gary Ave
- 351 Juniper Ct
- 1103 Maubert Ct
- 144 Goldenhill St Unit 3144
- 1107 Maubert Ct
- 177 Shaftesbury St
- 176 Goldenhill St
- 184 Goldenhill St
- 167 Goldenhill St
- 1121 Orangery Ct
- 1087 Orangery Ct
- 114 Goldenhill St
- 148 Goldenhill St
- 187 Shaftesbury St
- 193 Goldenhill St
- 1070 Bartholdi Ct
- 1062 Bartholdi Ct
- 1116 Bartholdi Ct
- 1128 Bartholdi Ct
- 1082 Bartholdi Ct
- 1115 Bartholdi Ct
- 106 Goldenhill St