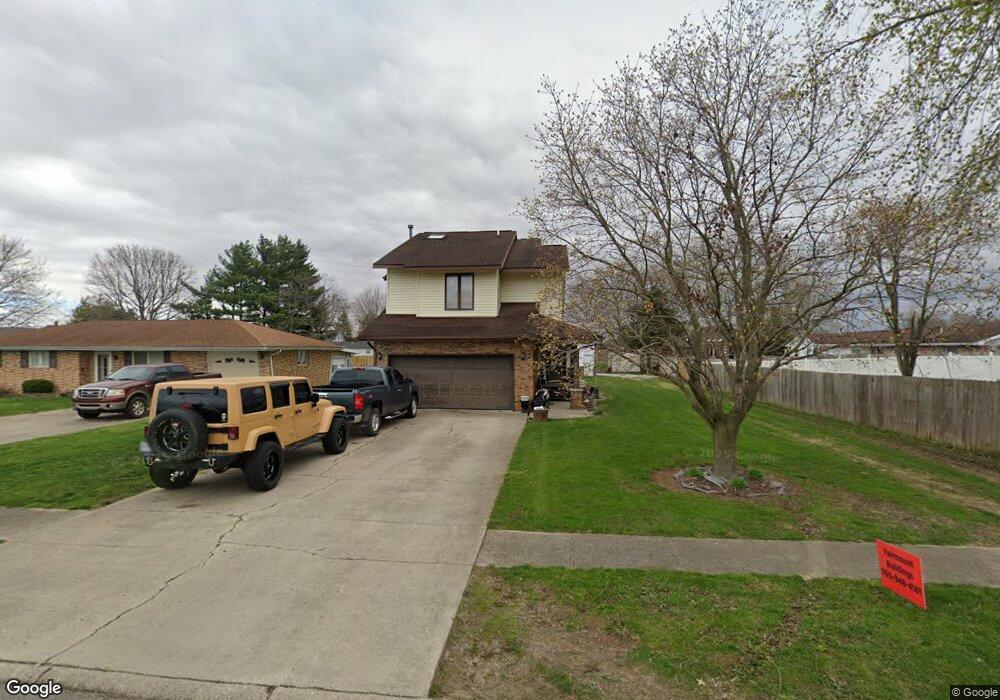
1103 N 18th St Elwood, IN 46036
Estimated Value: $219,000 - $292,000
3
Beds
2
Baths
1,620
Sq Ft
$150/Sq Ft
Est. Value
About This Home
This home is located at 1103 N 18th St, Elwood, IN 46036 and is currently estimated at $243,755, approximately $150 per square foot. 1103 N 18th St is a home located in Madison County with nearby schools including Elwood Elementary School, Elwood Intermediate School, and Elwood Junior-Senior High School.
Ownership History
Date
Name
Owned For
Owner Type
Purchase Details
Closed on
Jan 25, 2008
Sold by
Federal National Mortageg Assn
Bought by
Crawford Jaime L and Crawford Kisha R
Current Estimated Value
Purchase Details
Closed on
May 8, 2007
Sold by
Countrywide Home Loans Inc
Bought by
Federal National Mortgage Association
Purchase Details
Closed on
May 4, 2007
Sold by
Stewart Nancy
Bought by
Countrywide Home Loans Inc
Create a Home Valuation Report for This Property
The Home Valuation Report is an in-depth analysis detailing your home's value as well as a comparison with similar homes in the area
Home Values in the Area
Average Home Value in this Area
Purchase History
| Date | Buyer | Sale Price | Title Company |
|---|---|---|---|
| Crawford Jaime L | -- | -- | |
| Federal National Mortgage Association | -- | -- | |
| Countrywide Home Loans Inc | $93,736 | -- |
Source: Public Records
Mortgage History
| Date | Status | Borrower | Loan Amount |
|---|---|---|---|
| Closed | Crawford Jaime L | $0 |
Source: Public Records
Tax History Compared to Growth
Tax History
| Year | Tax Paid | Tax Assessment Tax Assessment Total Assessment is a certain percentage of the fair market value that is determined by local assessors to be the total taxable value of land and additions on the property. | Land | Improvement |
|---|---|---|---|---|
| 2024 | $1,529 | $152,900 | $18,400 | $134,500 |
| 2023 | $1,359 | $135,500 | $17,600 | $117,900 |
| 2022 | $1,356 | $134,800 | $16,900 | $117,900 |
| 2021 | $1,242 | $124,400 | $16,900 | $107,500 |
| 2020 | $1,226 | $121,600 | $16,000 | $105,600 |
| 2019 | $1,195 | $118,500 | $16,000 | $102,500 |
| 2018 | $1,124 | $111,400 | $16,000 | $95,400 |
| 2017 | $1,103 | $110,300 | $16,000 | $94,300 |
| 2016 | $1,120 | $111,000 | $16,000 | $95,000 |
| 2014 | $1,125 | $112,500 | $16,000 | $96,500 |
| 2013 | $1,125 | $112,500 | $16,000 | $96,500 |
Source: Public Records
Map
Nearby Homes
- 1605 N K St
- 850 N Anderson St
- 1001 N 14th St
- 0 N 14th St
- 615 N Anderson St
- 828 N 13th St
- 611 N Anderson St
- 616 N Anderson St
- 853 N 12th St
- 1300 N F St
- xxx N D St
- 513 N 13th St
- 0 12 St N Unit MBR22066123
- 418 N 14th St
- 2107 N C St
- 2024 N B St
- 1309 N 8th St
- 0 N C St at N 10th St
- 2111 S A St
- 2321 S A St