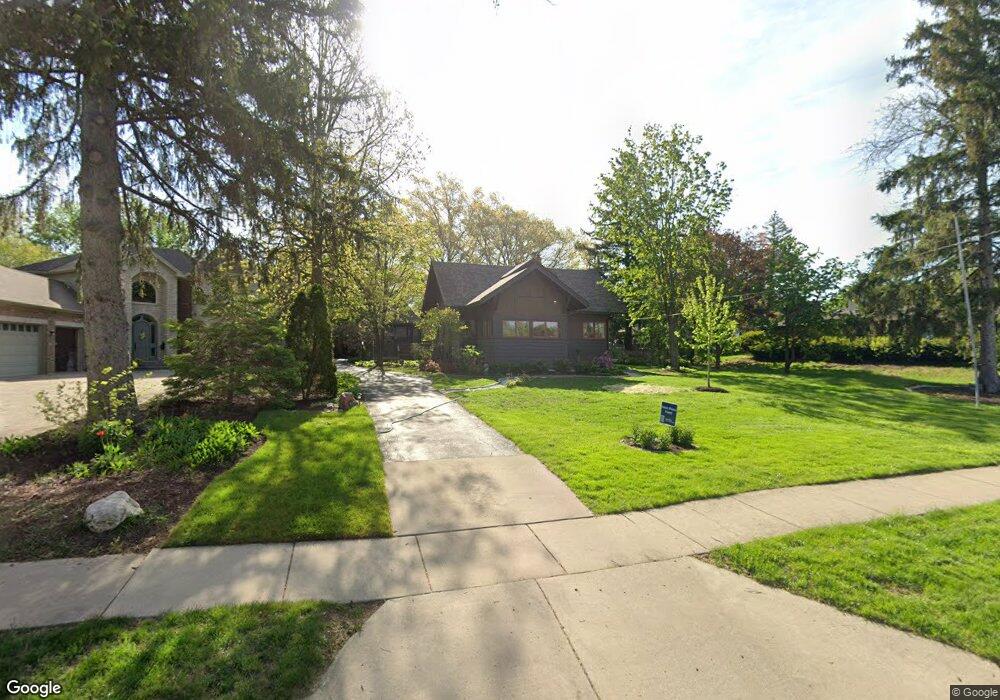
1103 N President St Wheaton, IL 60187
Hawthorne NeighborhoodEstimated Value: $657,403 - $672,000
3
Beds
2
Baths
2,280
Sq Ft
$292/Sq Ft
Est. Value
About This Home
This home is located at 1103 N President St, Wheaton, IL 60187 and is currently estimated at $665,351, approximately $291 per square foot. 1103 N President St is a home located in DuPage County with nearby schools including Washington Elementary School, Newark Elementary School, and Franklin Middle School.
Ownership History
Date
Name
Owned For
Owner Type
Purchase Details
Closed on
Jan 22, 2007
Sold by
Zaderaka Dennis and Zaderaka Debra
Bought by
Carstensen Howard W and Carstensen Linda R
Current Estimated Value
Home Financials for this Owner
Home Financials are based on the most recent Mortgage that was taken out on this home.
Original Mortgage
$48,000
Outstanding Balance
$28,798
Interest Rate
6.19%
Mortgage Type
Credit Line Revolving
Estimated Equity
$636,553
Purchase Details
Closed on
Mar 5, 1997
Sold by
Stewart Henry L and Stewart Virginia K
Bought by
Zaderaka Dennis and Zaderaka Debra
Home Financials for this Owner
Home Financials are based on the most recent Mortgage that was taken out on this home.
Original Mortgage
$50,000
Interest Rate
8%
Create a Home Valuation Report for This Property
The Home Valuation Report is an in-depth analysis detailing your home's value as well as a comparison with similar homes in the area
Home Values in the Area
Average Home Value in this Area
Purchase History
| Date | Buyer | Sale Price | Title Company |
|---|---|---|---|
| Carstensen Howard W | $481,000 | Attorneys Title Guaranty Fun | |
| Zaderaka Dennis | $342,000 | -- |
Source: Public Records
Mortgage History
| Date | Status | Borrower | Loan Amount |
|---|---|---|---|
| Open | Carstensen Howard W | $48,000 | |
| Open | Carstensen Howard W | $384,800 | |
| Previous Owner | Zaderaka Dennis | $50,000 | |
| Closed | Zaderaka Dennis | $150,000 |
Source: Public Records
Tax History Compared to Growth
Tax History
| Year | Tax Paid | Tax Assessment Tax Assessment Total Assessment is a certain percentage of the fair market value that is determined by local assessors to be the total taxable value of land and additions on the property. | Land | Improvement |
|---|---|---|---|---|
| 2024 | $11,436 | $185,427 | $37,959 | $147,468 |
| 2023 | $10,994 | $170,680 | $34,940 | $135,740 |
| 2022 | $10,756 | $161,310 | $33,020 | $128,290 |
| 2021 | $10,722 | $157,490 | $32,240 | $125,250 |
| 2020 | $10,689 | $156,020 | $31,940 | $124,080 |
| 2019 | $10,446 | $151,910 | $31,100 | $120,810 |
| 2018 | $10,684 | $153,510 | $32,960 | $120,550 |
| 2017 | $10,527 | $147,840 | $31,740 | $116,100 |
| 2016 | $10,390 | $141,930 | $30,470 | $111,460 |
| 2015 | $10,313 | $135,400 | $29,070 | $106,330 |
| 2014 | $10,276 | $132,730 | $35,810 | $96,920 |
| 2013 | $10,011 | $133,130 | $35,920 | $97,210 |
Source: Public Records
Map
Nearby Homes
- 1106 E North Path
- 719 N President St
- 1623 Sawyer Ave
- 230 Duane St Unit 3A
- 460 Pennsylvania Ave Unit C
- 808 Bridle Ln
- 300 Duane St Unit 3
- 270 Hawthorne Blvd
- 312 E Lincoln Ave
- 315 E Union Ave
- 1115 N Main St
- 1902 N Washington St
- 1108 N Main St
- 114 W Prairie Ave
- 314 Brookside Cir
- 305 Maple St
- 1919 Kingsbrook Ct
- 393 Duane St Unit 203
- 525 Timber Ridge Dr Unit 107
- 628 Belmont Ln
- 1111 N President St
- 1101 N President St
- 1025 E Forest Ave
- 1131 N President St
- 1049 E Forest Ave
- 1137 N President St
- 1110 N President St
- 1104 N President St
- 1102 N President St
- 1114 N President St
- 1141 N President St
- 1028 N President St
- 1103 E Forest Ave
- 1116 N President St
- 1040 E Forest Ave
- 919 E Forest Ave
- 919 E Forest Ave
- 1000 E Forest Ave
- 1122 N President St
- 1203 N President St