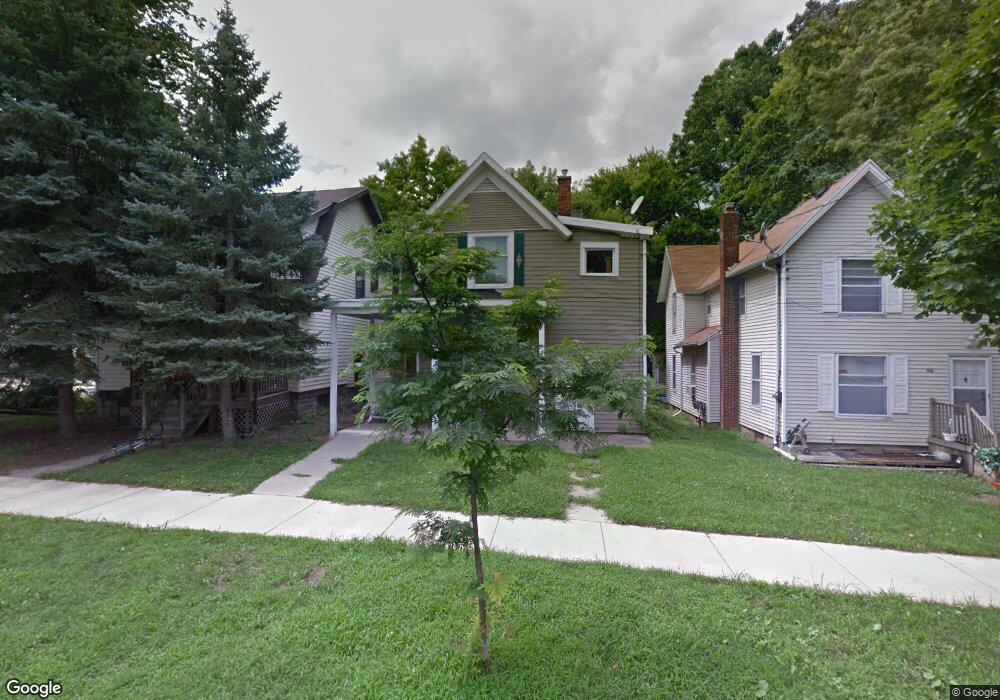
1103 N Walnut St Lansing, MI 48906
Old Forest NeighborhoodEstimated Value: $110,000 - $134,000
--
Bed
1
Bath
1,386
Sq Ft
$85/Sq Ft
Est. Value
About This Home
This home is located at 1103 N Walnut St, Lansing, MI 48906 and is currently estimated at $118,472, approximately $85 per square foot. 1103 N Walnut St is a home located in Ingham County with nearby schools including Willow School, Pattengill Academy, and J.W. Sexton High School.
Ownership History
Date
Name
Owned For
Owner Type
Purchase Details
Closed on
Feb 27, 2020
Sold by
Algrim Brenda J and Green Howard
Bought by
Indus Realty Llc
Current Estimated Value
Purchase Details
Closed on
Jul 2, 2002
Sold by
S & S Ltd Llc
Bought by
Algrim Brenda J
Home Financials for this Owner
Home Financials are based on the most recent Mortgage that was taken out on this home.
Original Mortgage
$48,000
Interest Rate
6.79%
Mortgage Type
Purchase Money Mortgage
Purchase Details
Closed on
Jul 26, 2001
Sold by
Capitol Invest Llc
Bought by
S & S Ltd Llc
Home Financials for this Owner
Home Financials are based on the most recent Mortgage that was taken out on this home.
Original Mortgage
$116,000
Interest Rate
7.11%
Mortgage Type
Credit Line Revolving
Purchase Details
Closed on
Jan 2, 1997
Bought by
Capitol Invest,
Create a Home Valuation Report for This Property
The Home Valuation Report is an in-depth analysis detailing your home's value as well as a comparison with similar homes in the area
Home Values in the Area
Average Home Value in this Area
Purchase History
| Date | Buyer | Sale Price | Title Company |
|---|---|---|---|
| Indus Realty Llc | $803,000 | Diversified National Title | |
| Algrim Brenda J | $53,350 | Midstate Title Company | |
| S & S Ltd Llc | $116,000 | First American Title Ins Co | |
| Capitol Invest, | $24,500 | -- |
Source: Public Records
Mortgage History
| Date | Status | Borrower | Loan Amount |
|---|---|---|---|
| Previous Owner | Algrim Brenda J | $48,000 | |
| Previous Owner | S & S Ltd Llc | $116,000 |
Source: Public Records
Tax History Compared to Growth
Tax History
| Year | Tax Paid | Tax Assessment Tax Assessment Total Assessment is a certain percentage of the fair market value that is determined by local assessors to be the total taxable value of land and additions on the property. | Land | Improvement |
|---|---|---|---|---|
| 2025 | $4,365 | $56,700 | $2,300 | $54,400 |
| 2024 | $37 | $51,400 | $2,300 | $49,100 |
| 2023 | $4,428 | $41,400 | $2,300 | $39,100 |
| 2022 | $8,816 | $37,000 | $2,600 | $34,400 |
| 2021 | $2,802 | $33,400 | $4,100 | $29,300 |
| 2020 | $2,334 | $30,200 | $4,100 | $26,100 |
| 2019 | $2,249 | $28,900 | $4,100 | $24,800 |
| 2018 | $2,138 | $26,500 | $4,100 | $22,400 |
| 2017 | $2,055 | $26,500 | $4,100 | $22,400 |
| 2016 | $1,988 | $26,000 | $4,100 | $21,900 |
| 2015 | $1,988 | $25,200 | $8,158 | $17,042 |
| 2014 | $1,988 | $25,000 | $12,250 | $12,750 |
Source: Public Records
Map
Nearby Homes
- 407 W César E Chávez Ave
- 423 W César E Chávez Ave
- 406 W Kilborn St
- 402 W César E Chávez Ave
- 1011 N Chestnut St
- 513 W Kilborn St
- 506 W Oakland Ave
- 1225 N Capitol Ave
- 624 Brook St
- 406 Pleasant St
- 824 Seymour Ave
- 810 N Walnut St
- 1336 N Chestnut St
- 1219 N Washington Ave
- 809 Seymour Ave
- 921 N Sycamore St
- 612 N Pine St
- 605 Seymour Ave
- 603 Seymour Ave
- 611 N Pine St
- 1101 N Walnut St
- 1109 N Walnut St
- 406 W Maple St
- 1111 N Walnut St
- 408 W Maple St
- 1035 N Walnut St
- 407 W Maple St
- 412 W Maple St
- 1100 N Walnut St
- 413 W Maple St
- 1117 N Walnut St
- 1104 N Walnut St
- 1104 N Walut
- 1025 N Walnut St
- 1119 N Walnut St
- 420 W Maple St
- 417 W Maple St
- 322 W Maple St Unit 2
- 1112 N Walnut St