Estimated Value: $48,000 - $62,000
--
Bed
1
Bath
720
Sq Ft
$77/Sq Ft
Est. Value
About This Home
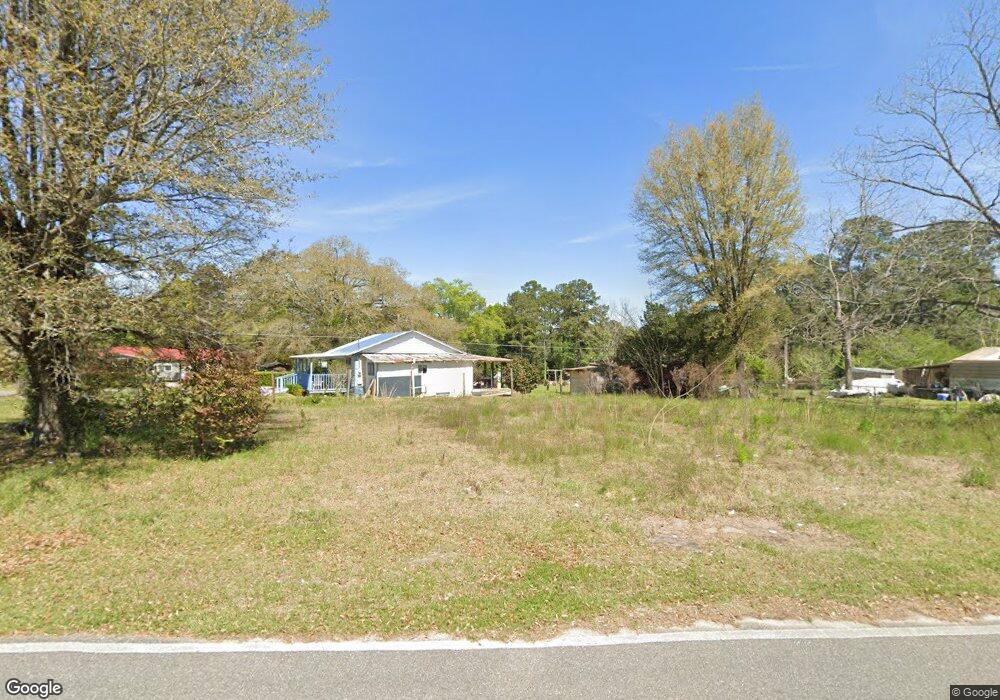
This home is located at 1103 Park Blvd, Cairo, GA 39828 and is currently estimated at $55,635, approximately $77 per square foot. 1103 Park Blvd is a home located in Grady County with nearby schools including Cairo High School.
Ownership History
Date
Name
Owned For
Owner Type
Purchase Details
Closed on
Feb 5, 2008
Sold by
Private Mortgage Group Llc
Bought by
Lemus Reywil Vivas
Current Estimated Value
Purchase Details
Closed on
Oct 2, 2007
Sold by
Sandefur Keith P
Bought by
Private Mtg Grp Llc
Purchase Details
Closed on
Oct 2, 2005
Sold by
Jordan Richard
Bought by
Lemus Reywil Vivas
Purchase Details
Closed on
Jul 9, 2004
Sold by
Vivas Edil Alfredo
Bought by
Lemus Reywil Vivas
Purchase Details
Closed on
May 9, 2003
Sold by
Cm Stone Bridge
Bought by
Vivas Edil Alfredo
Purchase Details
Closed on
Dec 18, 2002
Sold by
Cm Stone Bridge Enterp
Bought by
Cm Stone Bridge
Purchase Details
Closed on
Oct 17, 2002
Sold by
Capital City Bank
Bought by
Solomon Charles
Purchase Details
Closed on
Sep 12, 2002
Sold by
Lashley James
Bought by
Capital City Bank
Purchase Details
Closed on
Apr 19, 2001
Sold by
Gailey Linda
Bought by
Lashley James
Purchase Details
Closed on
Apr 8, 1997
Sold by
Adkins Walter Earl
Bought by
Gailey Linda
Purchase Details
Closed on
Aug 27, 1976
Bought by
Adkins Walter Earl
Create a Home Valuation Report for This Property
The Home Valuation Report is an in-depth analysis detailing your home's value as well as a comparison with similar homes in the area
Home Values in the Area
Average Home Value in this Area
Purchase History
| Date | Buyer | Sale Price | Title Company |
|---|---|---|---|
| Lemus Reywil Vivas | -- | -- | |
| Private Mtg Grp Llc | -- | -- | |
| Lemus Reywil Vivas | $570 | -- | |
| Lemus Reywil Vivas | -- | -- | |
| Vivas Edil Alfredo | $14,100 | -- | |
| Cm Stone Bridge | $11,000 | -- | |
| Solomon Charles | -- | -- | |
| Capital City Bank | -- | -- | |
| Lashley James | $2,800 | -- | |
| Gailey Linda | $6,800 | -- | |
| Adkins Walter Earl | -- | -- |
Source: Public Records
Tax History Compared to Growth
Tax History
| Year | Tax Paid | Tax Assessment Tax Assessment Total Assessment is a certain percentage of the fair market value that is determined by local assessors to be the total taxable value of land and additions on the property. | Land | Improvement |
|---|---|---|---|---|
| 2024 | $99 | $2,520 | $1,520 | $1,000 |
| 2023 | $46 | $1,242 | $1,242 | $0 |
| 2022 | $48 | $1,242 | $1,242 | $0 |
| 2021 | $210 | $5,436 | $1,242 | $4,194 |
| 2020 | $210 | $5,436 | $1,242 | $4,194 |
| 2019 | $210 | $5,436 | $1,242 | $4,194 |
| 2018 | $200 | $5,436 | $1,242 | $4,194 |
| 2017 | $192 | $5,436 | $1,242 | $4,194 |
| 2016 | $168 | $4,644 | $1,242 | $3,402 |
| 2015 | $166 | $4,644 | $1,242 | $3,402 |
| 2014 | $166 | $4,644 | $1,242 | $3,402 |
| 2013 | -- | $4,212 | $1,242 | $2,970 |
Source: Public Records
Map
Nearby Homes
- 00 NW 9th Ave
- 711 2nd Ave NE
- 0 20th St NE
- 00 20th St NE
- 4761 Hadley Ferry Rd
- 2975 U S 84
- 309 3rd St SE
- 471 4th St SE
- 66 22nd St NE
- 481 4th St SE
- X 1st St
- 00 Hwy 111 South Tract 1
- 316,322 NW 1st St + Lot
- 0 1st St
- 125 6th Ave NW
- 530 6th Ave SE
- 00 00 Hwy 111 South Tract 2
- 602 4th St SE
- 220 8th Ave NW
- 000 S Broad St
- 1102 8th Ave NE
- 1185 Park Blvd
- 1086 Park Blvd
- 751 11th St NE
- 1098 Park Blvd
- 1102 Park Blvd
- 1177 8th Ave NE
- 1105 8th Ave NE
- 1002 Park Blvd
- 802 8th Ave NE
- 1225 Park Blvd
- 1089 8th Ave NE
- 853 12th St NE
- 852 11th St NE
- 775 13th St NE
- 865 12th St NE
- 773 13th St NE
- 843 11th St NE
- 1019 8th Ave NE
- 691 10th St NE