Estimated Value: $86,000 - $148,196
3
Beds
1
Bath
1,129
Sq Ft
$116/Sq Ft
Est. Value
About This Home
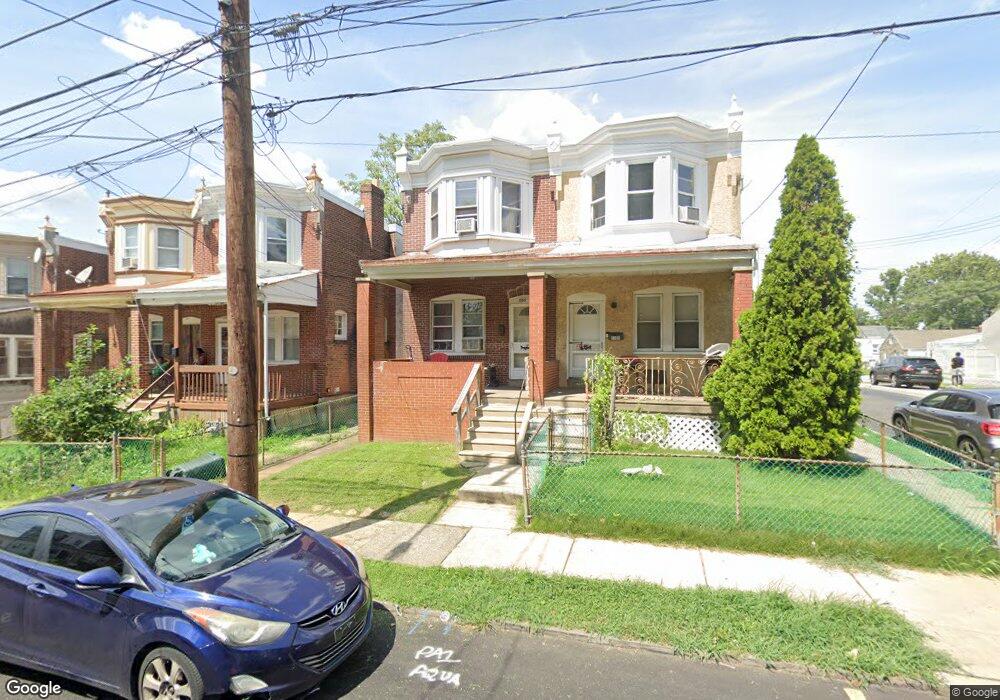
This home is located at 1103 Pine St, Darby, PA 19023 and is currently estimated at $130,799, approximately $115 per square foot. 1103 Pine St is a home located in Delaware County with nearby schools including Park Lane Elementary School, Penn Wood Middle School, and Penn Wood High School - Cypress Street Campus.
Ownership History
Date
Name
Owned For
Owner Type
Purchase Details
Closed on
Jul 8, 2015
Sold by
County Of Delaware
Bought by
Jah Mohammed M
Current Estimated Value
Purchase Details
Closed on
Dec 10, 2004
Sold by
Devine Mary L and Jenkins Carl H
Bought by
Lee William H and Lee Denise R
Home Financials for this Owner
Home Financials are based on the most recent Mortgage that was taken out on this home.
Original Mortgage
$43,225
Interest Rate
5.68%
Mortgage Type
Fannie Mae Freddie Mac
Purchase Details
Closed on
Mar 27, 1996
Sold by
Grant Patricia A and Grant Daniel W
Bought by
Devine Mary L and Jenkins Carl H
Home Financials for this Owner
Home Financials are based on the most recent Mortgage that was taken out on this home.
Original Mortgage
$36,349
Interest Rate
7.31%
Mortgage Type
FHA
Create a Home Valuation Report for This Property
The Home Valuation Report is an in-depth analysis detailing your home's value as well as a comparison with similar homes in the area
Home Values in the Area
Average Home Value in this Area
Purchase History
| Date | Buyer | Sale Price | Title Company |
|---|---|---|---|
| Jah Mohammed M | $6,169 | None Available | |
| Lee William H | $45,500 | -- | |
| Devine Mary L | $36,000 | Commonwealth Land Title Ins |
Source: Public Records
Mortgage History
| Date | Status | Borrower | Loan Amount |
|---|---|---|---|
| Previous Owner | Lee William H | $43,225 | |
| Previous Owner | Devine Mary L | $36,349 |
Source: Public Records
Tax History Compared to Growth
Tax History
| Year | Tax Paid | Tax Assessment Tax Assessment Total Assessment is a certain percentage of the fair market value that is determined by local assessors to be the total taxable value of land and additions on the property. | Land | Improvement |
|---|---|---|---|---|
| 2025 | $3,064 | $61,870 | $14,000 | $47,870 |
| 2024 | $3,064 | $61,870 | $14,000 | $47,870 |
| 2023 | $2,882 | $61,870 | $14,000 | $47,870 |
| 2022 | $2,804 | $61,870 | $14,000 | $47,870 |
| 2021 | $3,913 | $61,870 | $14,000 | $47,870 |
| 2020 | $3,688 | $50,490 | $13,270 | $37,220 |
| 2019 | $3,532 | $50,490 | $13,270 | $37,220 |
| 2018 | $3,489 | $50,490 | $0 | $0 |
| 2017 | $3,425 | $50,490 | $0 | $0 |
| 2016 | $283 | $50,490 | $0 | $0 |
| 2015 | $283 | $50,490 | $0 | $0 |
| 2014 | $283 | $50,490 | $0 | $0 |
Source: Public Records
Map
Nearby Homes