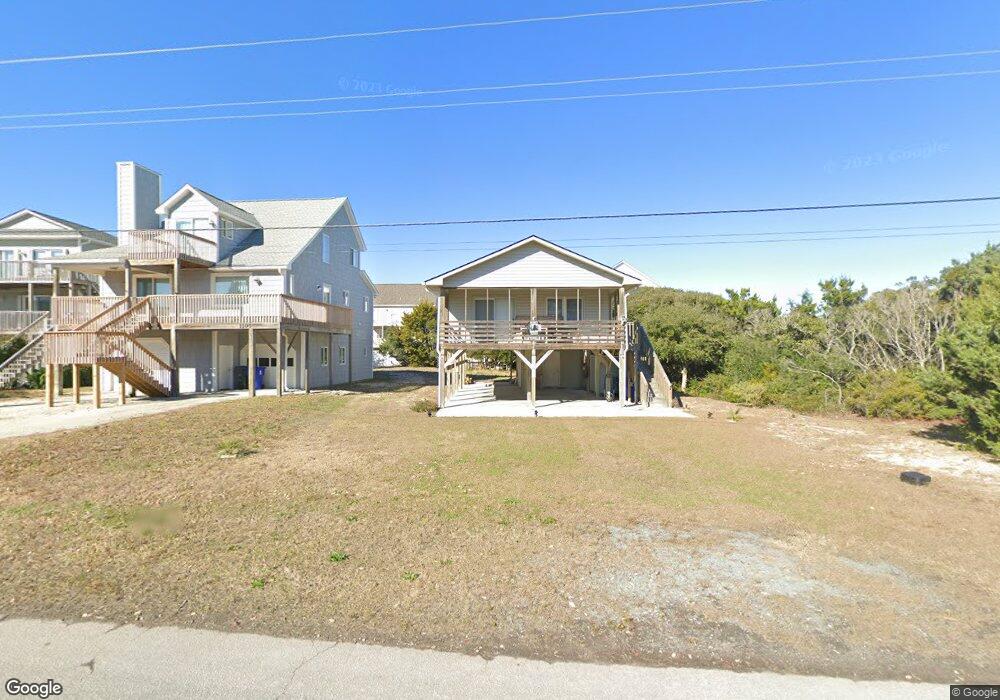
1103 S Shore Dr Holly Ridge, NC 28445
Estimated Value: $636,976 - $931,000
3
Beds
2
Baths
960
Sq Ft
$770/Sq Ft
Est. Value
About This Home
This home is located at 1103 S Shore Dr, Holly Ridge, NC 28445 and is currently estimated at $738,744, approximately $769 per square foot. 1103 S Shore Dr is a home with nearby schools including North Topsail Elementary School, Topsail Middle School, and Topsail High School.
Ownership History
Date
Name
Owned For
Owner Type
Purchase Details
Closed on
May 23, 2019
Sold by
Blackwell Matthew Calvin
Bought by
Williams Molly B
Current Estimated Value
Purchase Details
Closed on
May 21, 2019
Sold by
Blackwell James Boyd
Bought by
Williams Molly B
Purchase Details
Closed on
Aug 29, 2017
Sold by
Williams Molly B
Bought by
Williams Molly B and Blackwell Sarah Elizabeth
Purchase Details
Closed on
Dec 7, 2016
Sold by
Williams Molly B and Blackwell Bernice N
Bought by
Williams Molly B and Cullen Sarah Elizabeth Blackwell
Create a Home Valuation Report for This Property
The Home Valuation Report is an in-depth analysis detailing your home's value as well as a comparison with similar homes in the area
Home Values in the Area
Average Home Value in this Area
Purchase History
| Date | Buyer | Sale Price | Title Company |
|---|---|---|---|
| Williams Molly B | $43,500 | None Available | |
| Williams Molly B | $43,500 | None Available | |
| Williams Molly B | $43,500 | None Available | |
| Williams Molly B | -- | None Available | |
| Williams Molly B | -- | None Available |
Source: Public Records
Tax History Compared to Growth
Tax History
| Year | Tax Paid | Tax Assessment Tax Assessment Total Assessment is a certain percentage of the fair market value that is determined by local assessors to be the total taxable value of land and additions on the property. | Land | Improvement |
|---|---|---|---|---|
| 2024 | $2,417 | $291,245 | $213,185 | $78,060 |
| 2023 | $2,417 | $291,245 | $213,185 | $78,060 |
| 2022 | $2,148 | $291,245 | $213,185 | $78,060 |
| 2021 | $2,148 | $291,245 | $213,185 | $78,060 |
| 2020 | $2,148 | $291,245 | $213,185 | $78,060 |
| 2019 | $2,148 | $291,245 | $213,185 | $78,060 |
| 2018 | $1,839 | $236,536 | $180,250 | $56,286 |
| 2017 | $1,839 | $236,536 | $180,250 | $56,286 |
| 2016 | $1,815 | $236,536 | $180,250 | $56,286 |
| 2015 | -- | $236,536 | $180,250 | $56,286 |
| 2014 | $1,383 | $236,536 | $180,250 | $56,286 |
| 2013 | -- | $236,536 | $180,250 | $56,286 |
| 2012 | -- | $236,536 | $180,250 | $56,286 |
Source: Public Records
Map
Nearby Homes
- 1027 S Shore Dr
- 1103 S Topsail Dr
- 1125 S Topsail Dr
- 1001 S Topsail Dr
- 1131 S Shore Dr
- 1135 S Topsail Dr
- 1145 S Topsail Dr Unit A
- 123 Coastal Cay
- 822 S Topsail Dr Unit B
- 117 Coastal Cay
- 807 S Shore Dr Unit A
- 825 S Topsail Dr
- 612 S Topsail Dr
- 611 S Topsail Dr Unit A
- 607 S Topsail Dr
- 604 S Shore Dr
- 1402 S Shore Dr
- 107 Raleigh Ave
- 109 Raleigh Ave
- 108 Shaes Landing
- 1105 S Shore Dr
- 1107 S Shore Dr
- 1102 S Topsail Dr
- 1106 S Topsail Dr
- 1104 S Topsail Dr
- 101 Quarter Horse Dr
- 1106 S Shore Dr
- 1108 S Topsail Dr
- 1111 S Shore Dr
- 1110 S Topsail Dr
- 1110 S Shore Dr
- 1100 S Shore Dr
- 1025 S Shore Dr
- 1102 S Shore Dr
- 1022 S Topsail Dr
- 1108 S Shore Dr Unit B
- 1108 S Shore Dr
- 1108 S Shore Dr Unit A
- 1032 S Shore Dr
- 1113 S Shore Dr