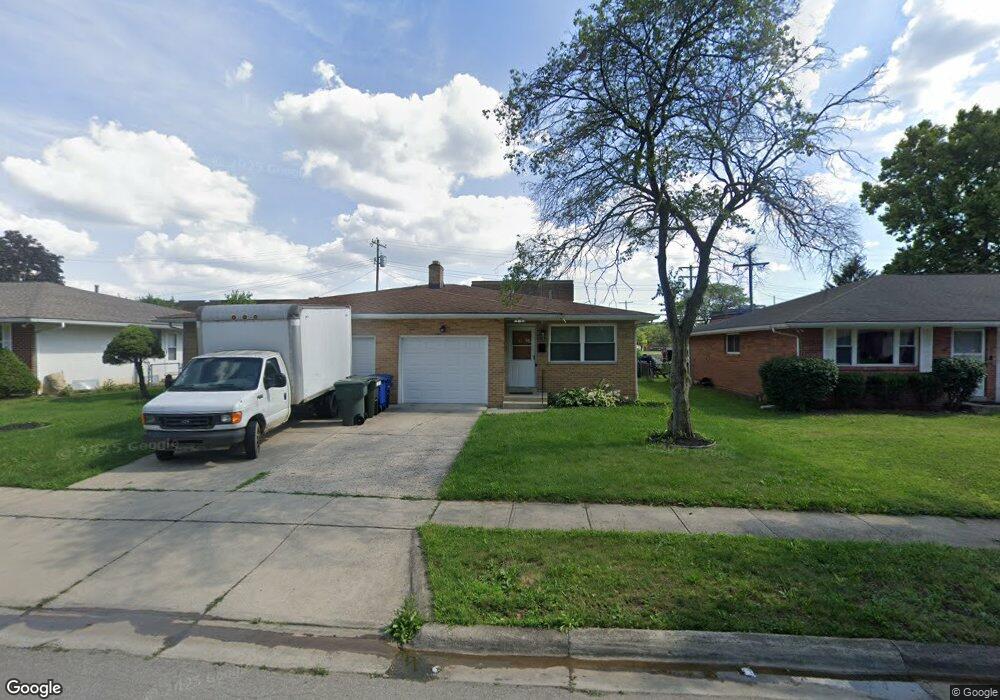
1103 Sagecrest Dr Unit 2 Columbus, OH 43229
Woodward Park NeighborhoodEstimated Value: $313,923 - $336,000
4
Beds
2
Baths
2,064
Sq Ft
$156/Sq Ft
Est. Value
About This Home
This home is located at 1103 Sagecrest Dr Unit 2, Columbus, OH 43229 and is currently estimated at $322,481, approximately $156 per square foot. 1103 Sagecrest Dr Unit 2 is a home located in Franklin County with nearby schools including Valley Forge Elementary School, Woodward Park Middle School, and Northland High School.
Ownership History
Date
Name
Owned For
Owner Type
Purchase Details
Closed on
Jun 9, 2025
Sold by
Cross Earl J
Bought by
Nunez Iris C
Current Estimated Value
Home Financials for this Owner
Home Financials are based on the most recent Mortgage that was taken out on this home.
Original Mortgage
$311,258
Outstanding Balance
$310,471
Interest Rate
6.89%
Mortgage Type
FHA
Estimated Equity
$12,010
Purchase Details
Closed on
Sep 29, 2008
Sold by
Aurora Loan Services Llc
Bought by
Cross Earl J
Home Financials for this Owner
Home Financials are based on the most recent Mortgage that was taken out on this home.
Original Mortgage
$110,000
Interest Rate
5.73%
Mortgage Type
VA
Purchase Details
Closed on
Mar 18, 2008
Sold by
Denton Brian L and Caes #07Cve07 9469
Bought by
Aurora Loan Services Llc
Purchase Details
Closed on
Jan 29, 2007
Sold by
Swick Investments Ii Ltd
Bought by
Denton Brian L
Home Financials for this Owner
Home Financials are based on the most recent Mortgage that was taken out on this home.
Original Mortgage
$167,000
Interest Rate
6.19%
Mortgage Type
Purchase Money Mortgage
Purchase Details
Closed on
Aug 2, 1999
Sold by
Kinnell Thomas P and Kinnell Artys B
Bought by
Swick Investments Ii Ltd
Purchase Details
Closed on
Aug 22, 1988
Bought by
Kinnell Artys B
Create a Home Valuation Report for This Property
The Home Valuation Report is an in-depth analysis detailing your home's value as well as a comparison with similar homes in the area
Home Values in the Area
Average Home Value in this Area
Purchase History
| Date | Buyer | Sale Price | Title Company |
|---|---|---|---|
| Nunez Iris C | $317,000 | Landsel Title Agency | |
| Cross Earl J | $110,000 | Accutitle Agency Inc | |
| Aurora Loan Services Llc | $160,000 | None Available | |
| Denton Brian L | $167,000 | Land Sel Ti | |
| Swick Investments Ii Ltd | $122,000 | Stewart Title Agency Of Colu | |
| Kinnell Artys B | $87,000 | -- |
Source: Public Records
Mortgage History
| Date | Status | Borrower | Loan Amount |
|---|---|---|---|
| Open | Nunez Iris C | $311,258 | |
| Previous Owner | Cross Earl J | $110,000 | |
| Previous Owner | Denton Brian L | $167,000 |
Source: Public Records
Tax History Compared to Growth
Tax History
| Year | Tax Paid | Tax Assessment Tax Assessment Total Assessment is a certain percentage of the fair market value that is determined by local assessors to be the total taxable value of land and additions on the property. | Land | Improvement |
|---|---|---|---|---|
| 2024 | $4,334 | $94,570 | $21,420 | $73,150 |
| 2023 | $4,280 | $94,570 | $21,420 | $73,150 |
| 2022 | $2,718 | $51,140 | $12,640 | $38,500 |
| 2021 | $2,723 | $51,140 | $12,640 | $38,500 |
| 2020 | $2,727 | $51,140 | $12,640 | $38,500 |
| 2019 | $2,542 | $40,880 | $10,080 | $30,800 |
| 2018 | $2,414 | $40,880 | $10,080 | $30,800 |
| 2017 | $2,541 | $40,880 | $10,080 | $30,800 |
| 2016 | $2,516 | $37,030 | $9,380 | $27,650 |
| 2015 | $2,290 | $37,030 | $9,380 | $27,650 |
| 2014 | $2,296 | $37,030 | $9,380 | $27,650 |
| 2013 | $1,242 | $38,990 | $9,870 | $29,120 |
Source: Public Records
Map
Nearby Homes
- 1116 Tulsa Dr
- 1125 Upland Dr
- 1071 Loring Rd
- 4904 Almont Dr
- 1266 Pershing Dr
- 4983 Almont Dr
- 4441 Wetmore Rd E
- 1414 Alvina Dr
- 4791 Bourke Rd
- 4815 Bourke Rd
- 4800 Bourke Rd
- 4816 Bourke Rd
- 4761 Colonel Perry Dr
- 1385 Thurell Rd
- 4455 Kenfield Rd
- 1191 Bryson Rd
- 4852 Colonel Perry Dr
- 1485 Norma Rd
- 1130 Carbone Dr
- 964 Strimple Ave
- 1103 Sagecrest Dr Unit 105
- 1091 Sagecrest Dr Unit 93
- 1091 Sagecrest Dr Unit 1093
- 1111 Sagecrest Dr Unit 113
- 1123 Sagecrest Dr Unit 125
- 1083 Sagecrest Dr Unit 85
- 1106 Sagecrest Dr Unit 108
- 1094 Sagecrest Dr Unit 96
- 1114 Sagecrest Dr Unit 116
- 1110 Morse Rd Unit 205
- 1110 Morse Rd Unit 201
- 1110 Morse Rd Unit 202
- 1110 Morse Rd Unit 102
- 1110 Morse Rd Unit Lower Level
- 1110 Morse Rd Unit 120D
- 1110 Morse Rd Unit 100
- 1110 Morse Rd Unit 101
- 1135 Sagecrest Dr Unit 137
- 1086 Sagecrest Dr Unit 88
- 4738 Kingshill Dr Unit 740