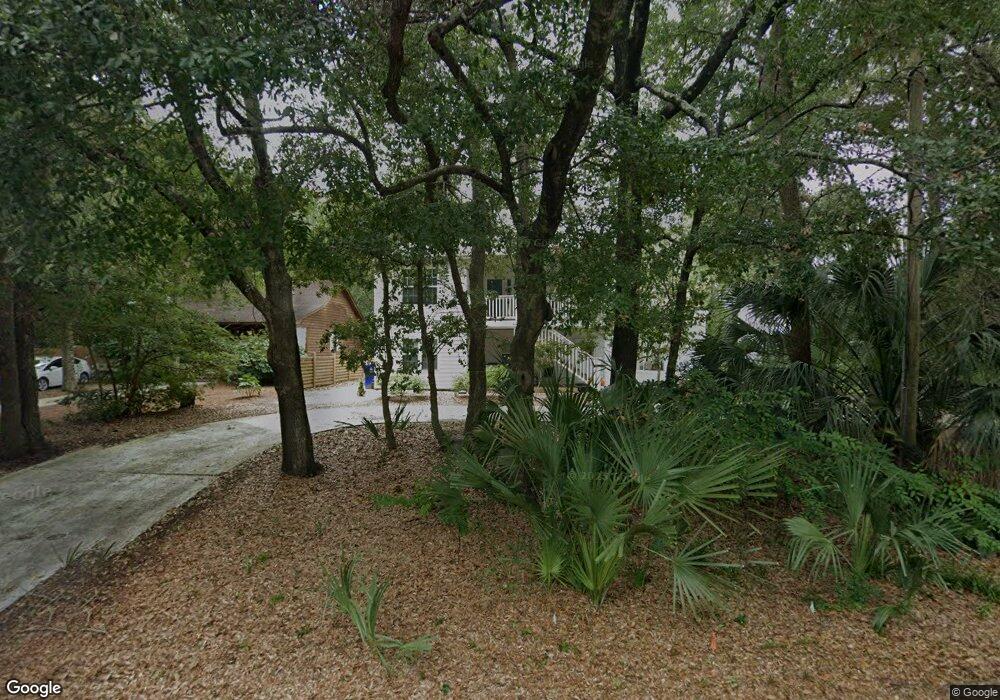
1103 Saint Joseph St Carolina Beach, NC 28428
Estimated Value: $676,000 - $792,000
4
Beds
3
Baths
1,960
Sq Ft
$375/Sq Ft
Est. Value
About This Home
This home is located at 1103 Saint Joseph St, Carolina Beach, NC 28428 and is currently estimated at $735,977, approximately $375 per square foot. 1103 Saint Joseph St is a home located in New Hanover County with nearby schools including Carolina Beach Elementary School, Charles P. Murray Middle School, and Eugene Ashley High School.
Ownership History
Date
Name
Owned For
Owner Type
Purchase Details
Closed on
Jan 26, 2007
Sold by
Bell Linda Diane Johnson
Bought by
Bell James Robert
Current Estimated Value
Purchase Details
Closed on
Jun 9, 2004
Sold by
Joyce Danny W Julia Y
Bought by
Bell James R Linda J
Purchase Details
Closed on
May 21, 2002
Sold by
Freeman Jr Ralph M
Bought by
Joyce Danny W Julia Y
Purchase Details
Closed on
Apr 27, 1993
Sold by
Levinson Joseph H Louise M
Bought by
Freeman Ralph M
Purchase Details
Closed on
Jun 1, 1984
Sold by
Fountain M J Jr Pearl W
Bought by
Levinson Joseph H
Purchase Details
Closed on
Jul 1, 1983
Sold by
Whitaker Herbert L
Bought by
Levinson Joseph H
Purchase Details
Closed on
Dec 1, 1981
Sold by
Pope Jerry T
Bought by
Whitaker Herbert L
Purchase Details
Closed on
Jun 1, 1963
Bought by
Pope Jerry T
Create a Home Valuation Report for This Property
The Home Valuation Report is an in-depth analysis detailing your home's value as well as a comparison with similar homes in the area
Home Values in the Area
Average Home Value in this Area
Purchase History
| Date | Buyer | Sale Price | Title Company |
|---|---|---|---|
| Bell James Robert | -- | None Available | |
| Bell James R Linda J | $266,000 | -- | |
| Joyce Danny W Julia Y | $173,500 | -- | |
| Freeman Ralph M | -- | -- | |
| Freeman Ralph M | $32,500 | -- | |
| Levinson Joseph H | $80,000 | -- | |
| Levinson Joseph H | $25,000 | -- | |
| Whitaker Herbert L | $6,000 | -- | |
| Pope Jerry T | -- | -- |
Source: Public Records
Tax History Compared to Growth
Tax History
| Year | Tax Paid | Tax Assessment Tax Assessment Total Assessment is a certain percentage of the fair market value that is determined by local assessors to be the total taxable value of land and additions on the property. | Land | Improvement |
|---|---|---|---|---|
| 2025 | $2,764 | $681,400 | $294,800 | $386,600 |
| 2023 | $2,764 | $403,500 | $161,800 | $241,700 |
| 2022 | $0 | $403,500 | $161,800 | $241,700 |
| 2021 | $2,310 | $403,500 | $161,800 | $241,700 |
| 2020 | $2,310 | $288,700 | $61,700 | $227,000 |
| 2019 | $2,310 | $288,700 | $61,700 | $227,000 |
| 2018 | $0 | $288,700 | $61,700 | $227,000 |
| 2017 | $2,295 | $288,700 | $61,700 | $227,000 |
| 2016 | $1,715 | $199,900 | $63,400 | $136,500 |
| 2015 | $1,617 | $199,900 | $63,400 | $136,500 |
| 2014 | $1,577 | $199,900 | $63,400 | $136,500 |
Source: Public Records
Map
Nearby Homes
- 109 Lighthouse Dr
- 140 Lighthouse Dr
- 1080 Saint Joseph St Unit 9E
- 1080 Saint Joseph St Unit 3b
- 1080 Saint Joseph St Unit P1
- 1080 Saint Joseph St Unit 4C
- 1030 Waterview Ct
- 1200 Saint Joseph St Unit 56
- 1200 Saint Joseph St Unit 26
- 1200 Saint Joseph St Unit 66
- 117 Hooks
- 1001 Waterview Place
- 114 Hooks
- 102 Hooks
- 901 Canal Dr
- 710 Canal Dr
- 715 Carolina Beach Ave N
- 208 Oak Outlook Way N
- 101 Seahorse Ln Unit D2
- 407 Donzi Ct
- 1101 Saint Joseph St
- 1107 Saint Joseph St
- 1105 Saint Joseph St
- 1037 Saint Joseph St
- 1037 Saint Joseph St
- 1037 Saint Joseph St
- 1109 Saint Joseph St
- 1105 Merchant Ln
- 1107 Merchant Ln
- 1103 Merchant Ln
- 103 Summer Salt Ln
- 116 Lighthouse Dr
- 114 Lighthouse Dr
- 118 Lighthouse Dr
- 112 Lighthouse Dr
- 110 Lighthouse Dr
- 105 Summer Salt Ln
- 108 Lighthouse Dr
- 101 Summer Salt Ln