Estimated Value: $332,208 - $426,000
4
Beds
3
Baths
2,351
Sq Ft
$155/Sq Ft
Est. Value
About This Home
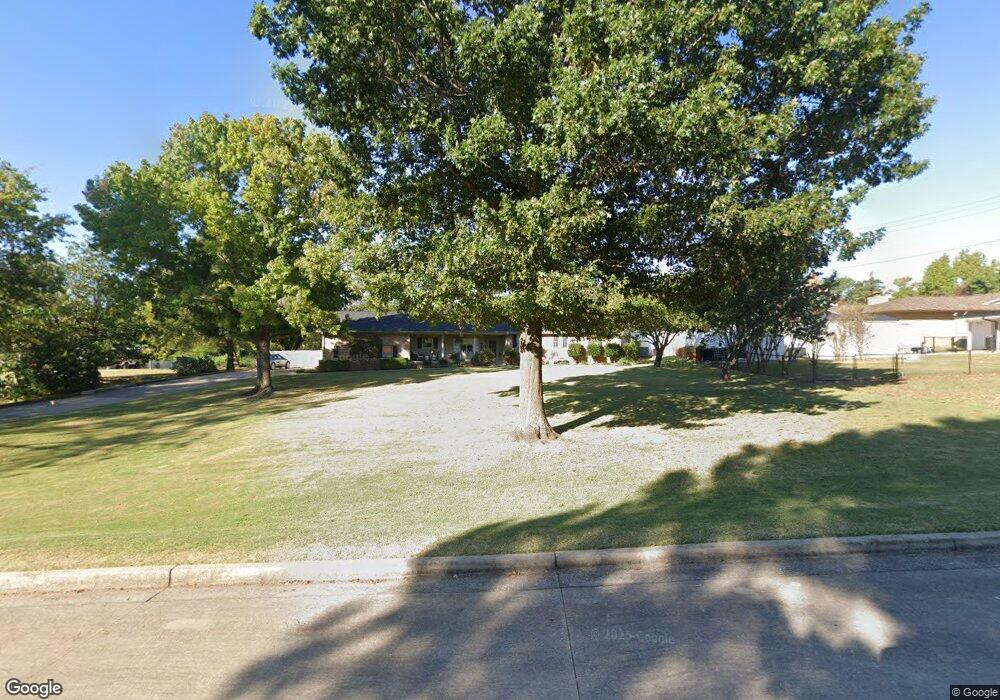
This home is located at 1103 Shaw Dr, Ada, OK 74820 and is currently estimated at $365,052, approximately $155 per square foot. 1103 Shaw Dr is a home located in Pontotoc County with nearby schools including ADA Early Childhood Center, Washington Elementary School, and Hayes Elementary School.
Ownership History
Date
Name
Owned For
Owner Type
Purchase Details
Closed on
Dec 16, 2014
Sold by
Asklund Dan C and Asklund Retha J
Bought by
Bryson Gregory and Justus Rebekah Yvette
Current Estimated Value
Home Financials for this Owner
Home Financials are based on the most recent Mortgage that was taken out on this home.
Original Mortgage
$251,692
Interest Rate
3.99%
Mortgage Type
Purchase Money Mortgage
Purchase Details
Closed on
Apr 18, 2011
Sold by
Thompson Michael O and Thompson Kym Koch
Bought by
Asklund Dan C and Asklund Retha J
Purchase Details
Closed on
Dec 26, 2001
Sold by
Retta Bill and Retta Ennis
Bought by
Retha Dan and Retha Asklund
Purchase Details
Closed on
Aug 2, 2001
Sold by
Linda Sue Wood
Bought by
Bill Ennis Etal
Create a Home Valuation Report for This Property
The Home Valuation Report is an in-depth analysis detailing your home's value as well as a comparison with similar homes in the area
Home Values in the Area
Average Home Value in this Area
Purchase History
| Date | Buyer | Sale Price | Title Company |
|---|---|---|---|
| Bryson Gregory | $250,000 | None Available | |
| Asklund Dan C | -- | None Available | |
| Thompson Michael O | -- | None Available | |
| Retha Dan | $152,000 | -- | |
| Bill Ennis Etal | $154,000 | -- |
Source: Public Records
Mortgage History
| Date | Status | Borrower | Loan Amount |
|---|---|---|---|
| Closed | Bryson Gregory | $251,692 |
Source: Public Records
Tax History Compared to Growth
Tax History
| Year | Tax Paid | Tax Assessment Tax Assessment Total Assessment is a certain percentage of the fair market value that is determined by local assessors to be the total taxable value of land and additions on the property. | Land | Improvement |
|---|---|---|---|---|
| 2025 | $3,517 | $35,455 | $2,700 | $32,755 |
| 2024 | $3,517 | $33,766 | $2,700 | $31,066 |
| 2023 | $3,517 | $32,159 | $2,700 | $29,459 |
| 2022 | $3,209 | $30,628 | $2,700 | $27,928 |
| 2021 | $2,861 | $30,628 | $2,700 | $27,928 |
| 2020 | $2,940 | $30,628 | $2,700 | $27,928 |
| 2019 | $2,943 | $30,628 | $2,700 | $27,928 |
| 2018 | $2,776 | $30,058 | $2,700 | $27,358 |
| 2017 | $2,592 | $30,058 | $2,700 | $27,358 |
| 2016 | $2,575 | $29,763 | $2,700 | $27,063 |
| 2015 | $2,614 | $29,763 | $4,800 | $24,963 |
| 2014 | -- | $17,000 | $600 | $16,400 |
Source: Public Records
Map
Nearby Homes
- 101 Hunter Dr
- 1100 S Broadway Ave
- 1108 S Broadway Ave
- 801 S Rennie St
- 120 Thompson Dr
- 115 W 18th St
- 100 E Kings Rd
- 1106 S Stockton Ave
- 1031 S Stockton St
- 1018 S Cherry St
- 817 S Stockton St
- 1310 S Cherry St
- 217 E 15th St
- 509 Cobblestone Dr
- 210 E 15th St
- 212 E 15th St
- 1024 Hillside Dr
- 413 E 14th St
- 722 E 18th St
- 500 W Kings Rd
- 121 Hunter Dr
- 131 Hunter Dr
- 1105 Shaw Dr
- 111 Hunter Dr
- 1030 S Broadway Ave
- 1100 Shaw Dr
- 1201 S Constant Dr
- 1304 S Constant Dr
- 126 Hunter Dr
- 1106 S Broadway Ave
- 130 Hunter Dr
- 1204 S Constant Dr
- 1100 S Constant Dr
- 220 Hunter Dr
- 200 Hunter Dr
- 1308 S Constant Dr
- 100 Hunter Dr
- 1005 S Broadway Ave
- 1000 S Townsend Dr
- 1202 S Constant Dr