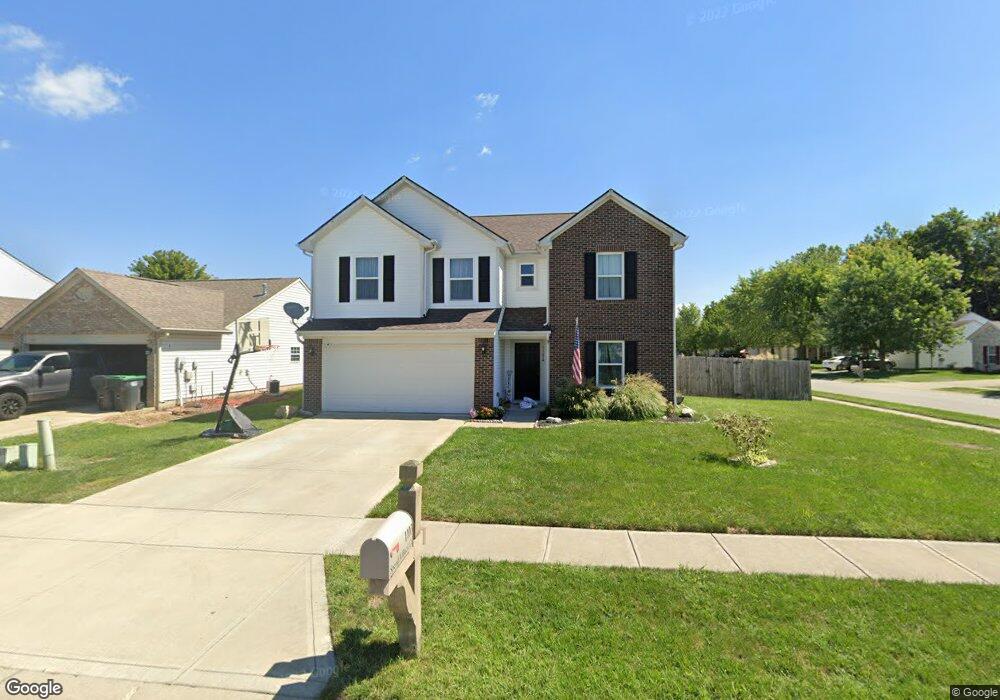
1103 Spend A Buck Ct Whiteland, IN 46184
Estimated Value: $306,000 - $324,000
3
Beds
3
Baths
2,542
Sq Ft
$124/Sq Ft
Est. Value
About This Home
This home is located at 1103 Spend A Buck Ct, Whiteland, IN 46184 and is currently estimated at $314,088, approximately $123 per square foot. 1103 Spend A Buck Ct is a home located in Johnson County with nearby schools including Break-O-Day Elementary School, Clark-Pleasant Middle School, and Whiteland Community High School.
Ownership History
Date
Name
Owned For
Owner Type
Purchase Details
Closed on
May 1, 2019
Sold by
Hardy Hyman
Bought by
Green Ryan P and Green Erica C
Current Estimated Value
Home Financials for this Owner
Home Financials are based on the most recent Mortgage that was taken out on this home.
Original Mortgage
$155,677
Outstanding Balance
$135,943
Interest Rate
3.87%
Mortgage Type
FHA
Estimated Equity
$178,145
Purchase Details
Closed on
Mar 30, 2012
Sold by
Arbor Homes Llc
Bought by
Hardy Hyman
Home Financials for this Owner
Home Financials are based on the most recent Mortgage that was taken out on this home.
Original Mortgage
$149,126
Interest Rate
3.5%
Mortgage Type
FHA
Purchase Details
Closed on
Dec 13, 2011
Sold by
Thomas & Thomas Developers Inc
Bought by
Arbor Homes Llc
Create a Home Valuation Report for This Property
The Home Valuation Report is an in-depth analysis detailing your home's value as well as a comparison with similar homes in the area
Home Values in the Area
Average Home Value in this Area
Purchase History
| Date | Buyer | Sale Price | Title Company |
|---|---|---|---|
| Green Ryan P | -- | Chicago Title | |
| Hardy Hyman | -- | None Available | |
| Arbor Homes Llc | -- | None Available |
Source: Public Records
Mortgage History
| Date | Status | Borrower | Loan Amount |
|---|---|---|---|
| Open | Green Ryan P | $155,677 | |
| Previous Owner | Hardy Hyman | $149,126 |
Source: Public Records
Tax History Compared to Growth
Tax History
| Year | Tax Paid | Tax Assessment Tax Assessment Total Assessment is a certain percentage of the fair market value that is determined by local assessors to be the total taxable value of land and additions on the property. | Land | Improvement |
|---|---|---|---|---|
| 2025 | $3,106 | $303,200 | $56,000 | $247,200 |
| 2024 | $3,106 | $296,800 | $56,000 | $240,800 |
| 2023 | $3,003 | $287,400 | $56,000 | $231,400 |
| 2022 | $2,589 | $248,900 | $29,900 | $219,000 |
| 2021 | $2,188 | $209,900 | $29,900 | $180,000 |
| 2020 | $1,920 | $183,400 | $29,900 | $153,500 |
| 2019 | $1,801 | $172,200 | $29,900 | $142,300 |
| 2018 | $1,723 | $172,200 | $21,100 | $151,100 |
| 2017 | $1,655 | $164,500 | $21,100 | $143,400 |
| 2016 | $1,616 | $161,600 | $21,100 | $140,500 |
| 2014 | $1,512 | $151,200 | $25,800 | $125,400 |
| 2013 | $1,512 | $152,400 | $25,800 | $126,600 |
Source: Public Records
Map
Nearby Homes
- 1119 Chateaugay Ct
- 1137 Chateaugay Ct
- 256 Bittersweet Dr
- 190 Tracy Ridge Blvd
- 106 Tracy Ridge Blvd
- 115 Windemere Rd
- 57 Oakden Ct
- 6540 N Us Highway 31
- 53 Oakden Ct
- 821 Princeton Dr
- 1000 Mount Olive Rd
- 551 Greenwood Trace Dr
- 523 Genisis Dr
- 250 Southlane Dr
- 1041 Mount Olive Rd
- 731 W 600 N
- 12 Rypma Row
- 840 Sweetbriar Ave
- 638 Harvest Meadow Way
- 559 Genisis Dr
- 1109 Spend A Buck Ct
- 1115 Spend A Buck Ct
- 1102 Chateaugay Ct
- 171 Hilltop Farms Blvd
- 1108 Chateaugay Ct
- 1104 Spend A Buck Ct
- 1121 Spend A Buck Ct
- 1110 Spend A Buck Ct
- 173 Hilltop Farms Blvd
- 1114 Chateaugay Ct
- 165 Hilltop Farms Blvd
- 1116 Spend A Buck Ct
- 175 Hilltop Farms Blvd
- 1122 Spend A Buck Ct
- 163 Hilltop Farms Blvd
- 1120 Chateaugay Ct
- 177 Hilltop Farms Blvd
- 1126 Chateaugay Ct
- 48 Hilltop Farms Blvd
- 161 Hilltop Farms Blvd