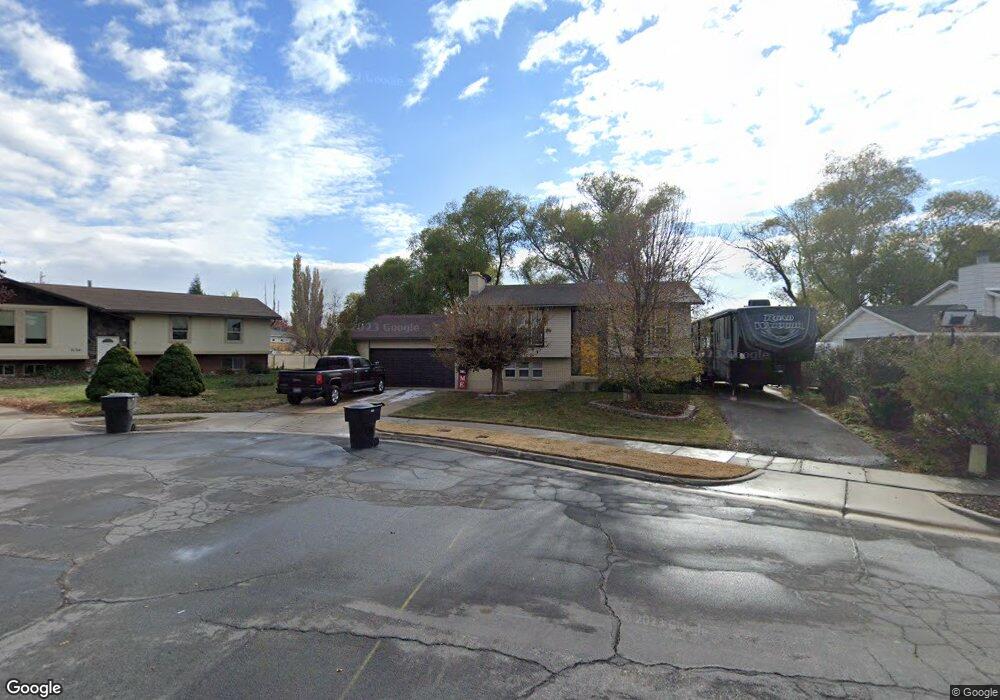
1103 W 2175 N Clearfield, UT 84015
Estimated Value: $431,000 - $492,948
4
Beds
2
Baths
2,029
Sq Ft
$224/Sq Ft
Est. Value
About This Home
This home is located at 1103 W 2175 N, Clearfield, UT 84015 and is currently estimated at $453,987, approximately $223 per square foot. 1103 W 2175 N is a home located in Davis County with nearby schools including Parkside Elementary School, Sunset Junior High School, and Clearfield High School.
Ownership History
Date
Name
Owned For
Owner Type
Purchase Details
Closed on
Mar 10, 2005
Sold by
The Secretary Of Housing And Urban Devel
Bought by
Richardson Bradley J
Current Estimated Value
Home Financials for this Owner
Home Financials are based on the most recent Mortgage that was taken out on this home.
Original Mortgage
$149,888
Outstanding Balance
$76,386
Interest Rate
5.79%
Mortgage Type
VA
Estimated Equity
$377,601
Purchase Details
Closed on
Feb 11, 2004
Sold by
Washington Mutual Bank Fa
Bought by
Hud
Purchase Details
Closed on
Jan 27, 2004
Sold by
Manzanares Michelle L
Bought by
Washington Mutual Bank
Purchase Details
Closed on
Oct 10, 2000
Sold by
Kotter Van K and Kotter Alice Z
Bought by
Manzanares Michelle L
Home Financials for this Owner
Home Financials are based on the most recent Mortgage that was taken out on this home.
Original Mortgage
$148,160
Interest Rate
7.96%
Mortgage Type
FHA
Create a Home Valuation Report for This Property
The Home Valuation Report is an in-depth analysis detailing your home's value as well as a comparison with similar homes in the area
Home Values in the Area
Average Home Value in this Area
Purchase History
| Date | Buyer | Sale Price | Title Company |
|---|---|---|---|
| Richardson Bradley J | -- | Monument Title Agency | |
| Hud | -- | First American Title Co | |
| Washington Mutual Bank | $165,971 | First Southwestern Title Age | |
| Manzanares Michelle L | -- | Heritage West Title Insuranc |
Source: Public Records
Mortgage History
| Date | Status | Borrower | Loan Amount |
|---|---|---|---|
| Open | Richardson Bradley J | $149,888 | |
| Previous Owner | Manzanares Michelle L | $148,160 |
Source: Public Records
Tax History Compared to Growth
Tax History
| Year | Tax Paid | Tax Assessment Tax Assessment Total Assessment is a certain percentage of the fair market value that is determined by local assessors to be the total taxable value of land and additions on the property. | Land | Improvement |
|---|---|---|---|---|
| 2025 | -- | $248,051 | $159,242 | $88,809 |
| 2024 | -- | $243,100 | $166,126 | $76,974 |
| 2023 | $300 | $410,000 | $205,141 | $204,859 |
| 2022 | $300 | $239,800 | $106,528 | $133,272 |
| 2021 | $0 | $328,000 | $166,383 | $161,617 |
| 2020 | $1,531 | $282,000 | $162,283 | $119,717 |
| 2019 | $1,531 | $269,000 | $152,376 | $116,624 |
| 2018 | $0 | $240,001 | $124,430 | $115,571 |
| 2016 | $1,489 | $107,196 | $52,235 | $54,961 |
| 2015 | $1,433 | $98,066 | $52,235 | $45,831 |
| 2014 | $1,416 | $98,423 | $52,235 | $46,188 |
| 2013 | $1,414 | $96,863 | $38,740 | $58,123 |
Source: Public Records
Map
Nearby Homes