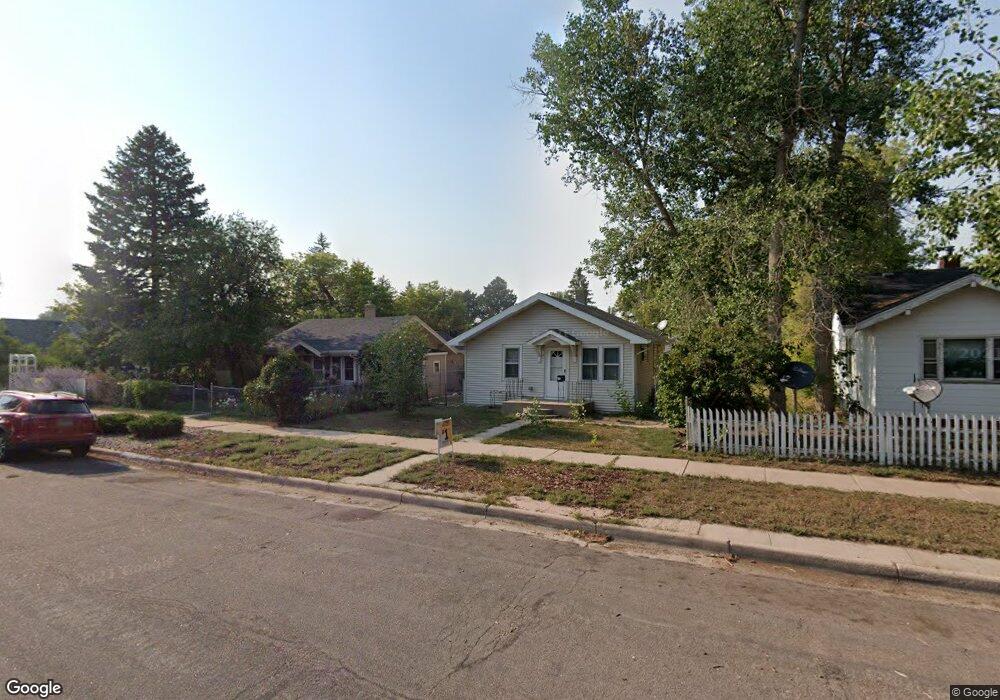
1103 W 29th St Cheyenne, WY 82001
Estimated Value: $188,000 - $246,000
Studio
--
Bath
507
Sq Ft
$422/Sq Ft
Est. Value
About This Home
This home is located at 1103 W 29th St, Cheyenne, WY 82001 and is currently estimated at $213,886, approximately $421 per square foot. 1103 W 29th St is a home located in Laramie County with nearby schools including Pioneer Park Elementary School, McCormick Junior High School, and Central High School.
Ownership History
Date
Name
Owned For
Owner Type
Purchase Details
Closed on
Feb 28, 2020
Sold by
Cook Shawn
Bought by
Comfee Llc
Current Estimated Value
Purchase Details
Closed on
Apr 14, 2015
Sold by
Capital Property Listings Llc
Bought by
Cook Shawn
Purchase Details
Closed on
Mar 10, 2015
Sold by
Capital Property Listing Llc
Bought by
Cook Shawn
Purchase Details
Closed on
Mar 31, 2011
Sold by
Capital Property Listings Llc
Bought by
Bahmer Tina
Home Financials for this Owner
Home Financials are based on the most recent Mortgage that was taken out on this home.
Original Mortgage
$400,000
Interest Rate
4.91%
Mortgage Type
Commercial
Purchase Details
Closed on
Jun 26, 2009
Sold by
Bahmer Tina L
Bought by
Capital Property Listings Llc
Purchase Details
Closed on
Aug 31, 2004
Sold by
Knox Kirk H
Bought by
Bahmer Tina
Create a Home Valuation Report for This Property
The Home Valuation Report is an in-depth analysis detailing your home's value as well as a comparison with similar homes in the area
Purchase History
| Date | Buyer | Sale Price | Title Company |
|---|---|---|---|
| Comfee Llc | -- | None Available | |
| Cook Shawn | -- | None Available | |
| Cook Shawn | -- | None Available | |
| Capital Propery Listings Llc | -- | None Available | |
| Bahmer Tina | -- | None Available | |
| Capital Property Listings Llc | -- | None Available | |
| Bahmer Tina | -- | -- |
Source: Public Records
Mortgage History
| Date | Status | Borrower | Loan Amount |
|---|---|---|---|
| Previous Owner | Bahmer Tina | $400,000 |
Source: Public Records
Tax History
| Year | Tax Paid | Tax Assessment Tax Assessment Total Assessment is a certain percentage of the fair market value that is determined by local assessors to be the total taxable value of land and additions on the property. | Land | Improvement |
|---|---|---|---|---|
| 2025 | $811 | $8,845 | $2,519 | $6,326 |
| 2024 | $811 | $11,468 | $3,358 | $8,110 |
| 2023 | $789 | $11,157 | $3,358 | $7,799 |
| 2022 | $713 | $9,873 | $3,358 | $6,515 |
| 2021 | $655 | $9,048 | $3,358 | $5,690 |
| 2020 | $606 | $8,406 | $3,358 | $5,048 |
| 2019 | $592 | $8,201 | $3,358 | $4,843 |
| 2018 | $519 | $7,254 | $2,778 | $4,476 |
| 2017 | $493 | $6,827 | $2,778 | $4,049 |
| 2016 | $461 | $6,384 | $2,557 | $3,827 |
| 2015 | $459 | $6,358 | $2,557 | $3,801 |
| 2014 | $432 | $5,940 | $2,557 | $3,383 |
Source: Public Records
Map
Nearby Homes
- 1122 W 28th St
- 1114 W 27th St
- 906 Talbot Ct
- 3016 Ames Ct
- 3018 Cribbon Ave
- 2515 Snyder Ave
- 1117 W 31st St
- 2813 Bent Ave
- 3205 Reed Ave
- 601 W 25th St
- 3306 Mccomb Ave
- 3515 Dillon Ave
- 2012 Snyder Ave
- 1114 W 20th St
- 1915 Dillon Ave
- 109 W 1st Ave
- Diamond B Ranch Tract 9
- 3422 Warren Ave
- 305 E 28th St
- 316 E Pershing Blvd
Your Personal Tour Guide
Ask me questions while you tour the home.