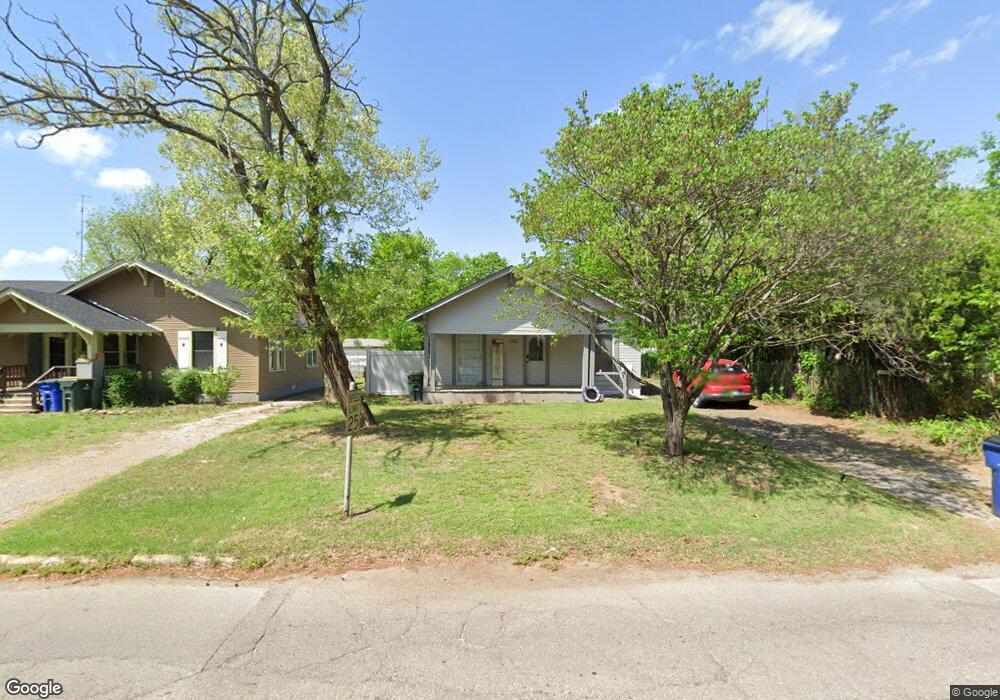
1103 W Beech Ave Duncan, OK 73533
Estimated Value: $76,000 - $85,000
2
Beds
1
Bath
1,484
Sq Ft
$54/Sq Ft
Est. Value
About This Home
This home is located at 1103 W Beech Ave, Duncan, OK 73533 and is currently estimated at $80,787, approximately $54 per square foot. 1103 W Beech Ave is a home located in Stephens County with nearby schools including Emerson Elementary School, Duncan Middle School, and Duncan High School.
Ownership History
Date
Name
Owned For
Owner Type
Purchase Details
Closed on
Mar 11, 2022
Sold by
First Bank & Trust Co Duncan Oklahoma
Bought by
M1720 Llc
Current Estimated Value
Home Financials for this Owner
Home Financials are based on the most recent Mortgage that was taken out on this home.
Original Mortgage
$59,231
Outstanding Balance
$55,042
Interest Rate
3.92%
Mortgage Type
New Conventional
Estimated Equity
$25,745
Purchase Details
Closed on
Mar 28, 2011
Sold by
Jefferies Chris L and Jefferis Betty A
Bought by
Turpin Christopher E and Turpin Tamela J
Home Financials for this Owner
Home Financials are based on the most recent Mortgage that was taken out on this home.
Original Mortgage
$59,121
Interest Rate
5.06%
Mortgage Type
Purchase Money Mortgage
Purchase Details
Closed on
Dec 5, 2001
Sold by
Stapp Bill and Stapp Donna
Purchase Details
Closed on
Nov 13, 1991
Sold by
Byers Jim E
Purchase Details
Closed on
Sep 25, 1991
Sold by
Duncan Savings (Rtc)
Create a Home Valuation Report for This Property
The Home Valuation Report is an in-depth analysis detailing your home's value as well as a comparison with similar homes in the area
Purchase History
| Date | Buyer | Sale Price | Title Company |
|---|---|---|---|
| M1720 Llc | $13,333 | Old Republic Title | |
| Turpin Christopher E | -- | None Available | |
| -- | $25,000 | -- | |
| -- | $17,000 | -- | |
| -- | -- | -- |
Source: Public Records
Mortgage History
| Date | Status | Borrower | Loan Amount |
|---|---|---|---|
| Open | M1720 Llc | $59,231 | |
| Previous Owner | Turpin Christopher E | $59,121 |
Source: Public Records
Tax History
| Year | Tax Paid | Tax Assessment Tax Assessment Total Assessment is a certain percentage of the fair market value that is determined by local assessors to be the total taxable value of land and additions on the property. | Land | Improvement |
|---|---|---|---|---|
| 2025 | $515 | $6,104 | $550 | $5,554 |
| 2024 | $557 | $6,539 | $550 | $5,989 |
| 2023 | $557 | $6,760 | $550 | $6,210 |
| 2022 | $521 | $7,206 | $550 | $6,656 |
| 2021 | $521 | $6,123 | $550 | $5,573 |
| 2020 | $393 | $5,554 | $550 | $5,004 |
| 2019 | $399 | $5,612 | $550 | $5,062 |
| 2018 | $644 | $8,236 | $550 | $7,686 |
| 2017 | $633 | $8,369 | $550 | $7,819 |
| 2016 | $654 | $8,691 | $550 | $8,141 |
| 2015 | $664 | $8,660 | $550 | $8,110 |
| 2014 | $664 | $8,408 | $770 | $7,638 |
Source: Public Records
Map
Nearby Homes
- 1106 W Ash Ave
- 915 W Chestnut Ave
- 1037 W Hickory Ave
- 1309 W Beech Ave
- 1314 W Beech Ave
- 1275 N 10th St
- 809 W Beech Ave
- 1203 W Walnut Ave
- 905 W Pine Ave
- 27 N 14th St
- 1408 W Walnut Ave
- 0 Alaska Unit 2602709
- 123 N Highway 81
- 722 N 8th St
- 1309 W Spruce Ave
- 1315 W Spruce Ave
- 1705 W Ash Ave
- 512 W Oak Ave
- 512 W Pine Ave
- 1112 N 12th St
- 1103 W Beech Ave
- 1101 1101 W Beech
- 1101 W Beech Ave
- 1109 W Beech Ave
- 1104 W Chestnut Ave Unit 12
- 1104 W Chestnut Ave
- 1106 W Chestnut Ave
- 1102 W Chestnut Ave
- 1108 W Chestnut Ave
- 311 N 11th St
- 1015 W Beech Ave
- 1106 W Beech Ave
- 1108 W Beech Ave
- 1114 W Chestnut Ave
- 1014 W Chestnut Ave
- 1110 W Beech Ave
- 1112 W Beech Ave
- 309 N 11th St
- 1013 W Beech Ave
- 1012 W Chestnut Ave
Your Personal Tour Guide
Ask me questions while you tour the home.