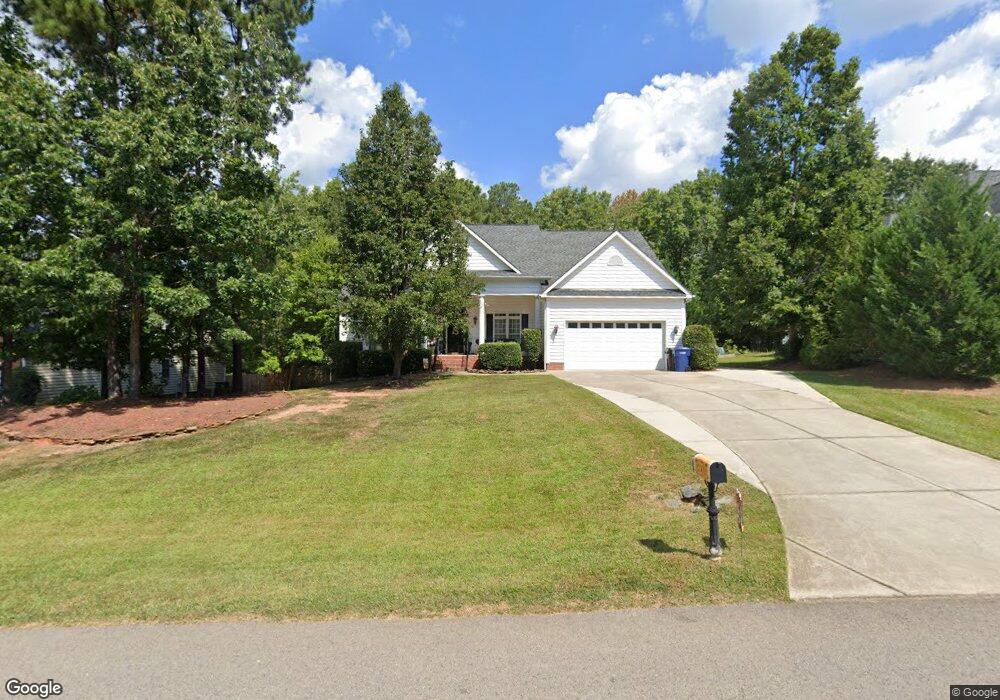
1103 Wynns Dr Sanford, NC 27330
Estimated Value: $491,000 - $549,000
4
Beds
3
Baths
3,371
Sq Ft
$153/Sq Ft
Est. Value
About This Home
This home is located at 1103 Wynns Dr, Sanford, NC 27330 and is currently estimated at $515,569, approximately $152 per square foot. 1103 Wynns Dr is a home located in Lee County with nearby schools including J.R. Ingram Jr. Elementary School, West Lee Middle School, and Southern Lee High School.
Ownership History
Date
Name
Owned For
Owner Type
Purchase Details
Closed on
May 25, 2018
Sold by
Rhodes Ryan N and Rhodes Mckenzie H
Bought by
Sama Samuel and Sama Adilia
Current Estimated Value
Home Financials for this Owner
Home Financials are based on the most recent Mortgage that was taken out on this home.
Original Mortgage
$295,213
Outstanding Balance
$254,188
Interest Rate
4.4%
Mortgage Type
VA
Estimated Equity
$261,381
Purchase Details
Closed on
Jun 30, 2008
Sold by
M & R Associates Of Sanford Nc Inc
Bought by
Rhodes Ryan N and Rhodes Mckenzie H
Home Financials for this Owner
Home Financials are based on the most recent Mortgage that was taken out on this home.
Original Mortgage
$250,075
Interest Rate
5.97%
Mortgage Type
FHA
Purchase Details
Closed on
Aug 19, 1994
Bought by
West Landing Development
Create a Home Valuation Report for This Property
The Home Valuation Report is an in-depth analysis detailing your home's value as well as a comparison with similar homes in the area
Home Values in the Area
Average Home Value in this Area
Purchase History
| Date | Buyer | Sale Price | Title Company |
|---|---|---|---|
| Sama Samuel | $289,000 | None Available | |
| Rhodes Ryan N | $254,000 | None Available | |
| West Landing Development | -- | -- |
Source: Public Records
Mortgage History
| Date | Status | Borrower | Loan Amount |
|---|---|---|---|
| Open | Sama Samuel | $295,213 | |
| Previous Owner | Rhodes Ryan N | $250,075 |
Source: Public Records
Tax History Compared to Growth
Tax History
| Year | Tax Paid | Tax Assessment Tax Assessment Total Assessment is a certain percentage of the fair market value that is determined by local assessors to be the total taxable value of land and additions on the property. | Land | Improvement |
|---|---|---|---|---|
| 2025 | $5,832 | $462,600 | $36,000 | $426,600 |
| 2024 | $5,832 | $462,600 | $36,000 | $426,600 |
| 2023 | $5,822 | $462,600 | $36,000 | $426,600 |
| 2022 | $4,298 | $294,700 | $35,000 | $259,700 |
| 2021 | $4,377 | $294,700 | $35,000 | $259,700 |
| 2020 | $4,362 | $294,700 | $35,000 | $259,700 |
| 2019 | $4,322 | $294,700 | $35,000 | $259,700 |
| 2018 | $4,246 | $284,200 | $35,000 | $249,200 |
| 2017 | $3,531 | $237,000 | $35,000 | $202,000 |
| 2016 | $3,506 | $237,000 | $35,000 | $202,000 |
| 2014 | $3,328 | $237,000 | $35,000 | $202,000 |
Source: Public Records
Map
Nearby Homes
- 2101 Wimberly Woods Dr
- 1508 Westfall Cir
- 1700 Phillips Dr
- 3309 Westcott Cir
- 0 Phillips Dr Unit 10088155
- 2017 Owls Nest Rd
- 1816 Phillips Dr
- 5224 Tyndall Dr
- 5228 Tyndall Dr
- 5232 Tyndall Dr
- 729 Richardson Dr
- 5220 Tyndall Dr
- 5058 Tyndall Dr
- 5054 Tyndall Dr
- 5216 Tyndall Dr
- 737 Richardson Dr
- 5212 Tyndall Dr
- Freelance Plan at Brantley Place
- Intrigue Plan at Brantley Place
- Prelude Plan at Brantley Place
- 1103 Wynns Rd
- 1106 Wynns Dr
- 1105 Wynns Rd
- 1106 Wynns Rd
- 1101 Wynns Dr
- 1100 W Landing Dr
- 1107 Wynns Dr
- 1107 Wynns Rd
- 1102 Wynns Dr
- 1104 Wynns Rd
- 0 Wynns Rd Unit 680349
- 0 Wynns Rd Unit 680350
- 1102 Wynns Rd
- 1104 W Landing Dr
- 1402 Windfall Dr
- 1108 Wynns Rd
- 1112 Wynns Dr
- 1402 Windfall Ct
- 1402 Windfall Rd
- 1404 Windfall Rd