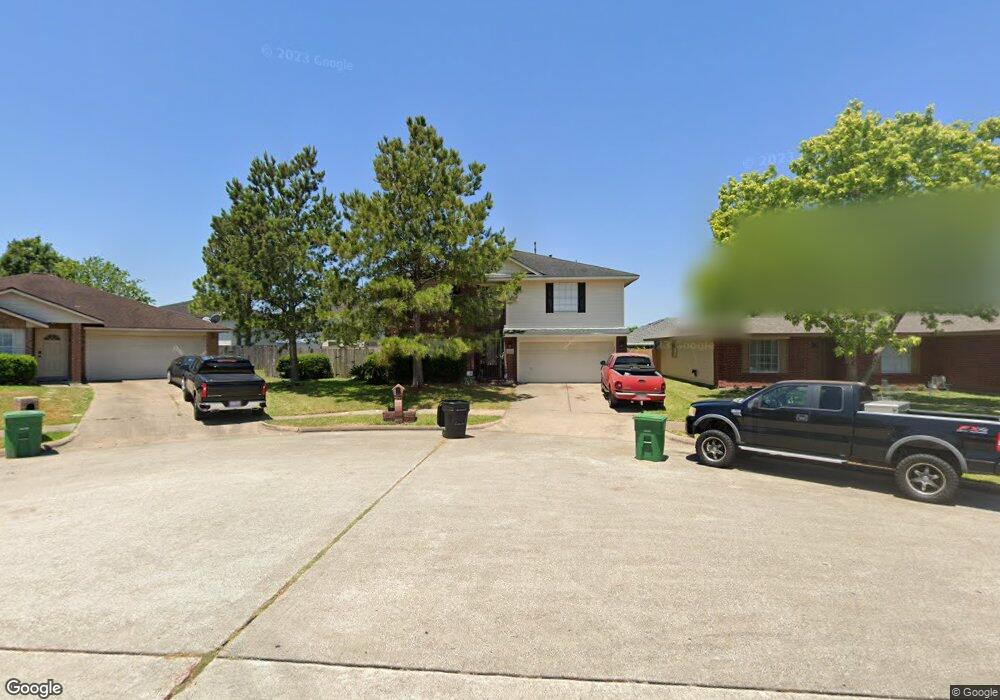
11030 Linden Gate Dr Houston, TX 77075
Southbelt-Ellington NeighborhoodEstimated Value: $301,259 - $390,000
3
Beds
3
Baths
2,556
Sq Ft
$134/Sq Ft
Est. Value
About This Home
This home is located at 11030 Linden Gate Dr, Houston, TX 77075 and is currently estimated at $343,315, approximately $134 per square foot. 11030 Linden Gate Dr is a home located in Harris County with nearby schools including Atkinson Elementary School, Morris Middle School, and Beverly Hill Intermediate School.
Ownership History
Date
Name
Owned For
Owner Type
Purchase Details
Closed on
Mar 28, 2002
Sold by
Roanoke Building Company Lp
Bought by
Hernandez Tommy A and Hernandez Diana L
Current Estimated Value
Home Financials for this Owner
Home Financials are based on the most recent Mortgage that was taken out on this home.
Original Mortgage
$123,576
Outstanding Balance
$51,301
Interest Rate
6.83%
Mortgage Type
FHA
Estimated Equity
$292,014
Purchase Details
Closed on
Feb 18, 2002
Sold by
Parkstone Building Company Lp
Bought by
Roanoke Building Company Lp
Home Financials for this Owner
Home Financials are based on the most recent Mortgage that was taken out on this home.
Original Mortgage
$123,576
Outstanding Balance
$51,301
Interest Rate
6.83%
Mortgage Type
FHA
Estimated Equity
$292,014
Create a Home Valuation Report for This Property
The Home Valuation Report is an in-depth analysis detailing your home's value as well as a comparison with similar homes in the area
Home Values in the Area
Average Home Value in this Area
Purchase History
| Date | Buyer | Sale Price | Title Company |
|---|---|---|---|
| Hernandez Tommy A | -- | Commonwealth Title | |
| Roanoke Building Company Lp | -- | -- |
Source: Public Records
Mortgage History
| Date | Status | Borrower | Loan Amount |
|---|---|---|---|
| Open | Hernandez Tommy A | $123,576 |
Source: Public Records
Tax History Compared to Growth
Tax History
| Year | Tax Paid | Tax Assessment Tax Assessment Total Assessment is a certain percentage of the fair market value that is determined by local assessors to be the total taxable value of land and additions on the property. | Land | Improvement |
|---|---|---|---|---|
| 2025 | $5,211 | $310,923 | $53,715 | $257,208 |
| 2024 | $5,211 | $306,176 | $53,715 | $252,461 |
| 2023 | $5,211 | $334,461 | $53,715 | $280,746 |
| 2022 | $6,327 | $280,453 | $41,223 | $239,230 |
| 2021 | $6,036 | $224,678 | $41,223 | $183,455 |
| 2020 | $5,942 | $216,766 | $37,475 | $179,291 |
| 2019 | $5,926 | $211,974 | $34,352 | $177,622 |
| 2018 | $2,155 | $186,873 | $26,545 | $160,328 |
| 2017 | $5,146 | $186,873 | $26,545 | $160,328 |
| 2016 | $4,757 | $172,741 | $24,047 | $148,694 |
| 2015 | $3,381 | $163,752 | $21,861 | $141,891 |
| 2014 | $3,381 | $151,252 | $21,861 | $129,391 |
Source: Public Records
Map
Nearby Homes
- 11019 Cayman Mist Dr
- 10934 Bradford Way Dr
- 10918 Linden Gate Dr
- 9130 Garden Breeze Dr
- 10831 Cayman Mist Dr
- 10827 Linden Gate Dr
- 10858 Shannon Mills Ln
- 10847 Nellsfield Ln
- 8706 Kirkmont Dr
- 8723 Kirkmont Dr
- 9115 Kingsrose Ln
- 9303 Kingsflower Cir
- 9423 Garden Bridge St
- 7329 Madison Commons Ln
- 7322 Madison Commons Ln
- 11115 Opal Glen Ln
- 0 Fuqua St Unit 64883593
- 0 Fuqua St Unit 45902141
- 0 Fuqua St Unit 97219329
- 9307 Fuqua Ridge Ln
- 11026 Linden Gate Dr
- 11034 Linden Gate Dr
- 11031 Bradford Way Dr
- 11035 Bradford Way Dr
- 11027 Bradford Way Dr
- 11022 Linden Gate Dr
- 11038 Linden Gate Dr
- 11039 Bradford Way Dr
- 11023 Bradford Way Dr
- 11031 Linden Gate Dr
- 11027 Linden Gate Dr
- 11035 Linden Gate Dr
- 11018 Linden Gate Dr
- 11103 Bradford Way Dr
- 11106 Linden Gate Dr
- 11102 Linden Gate Dr
- 11019 Bradford Way Dr
- 11023 Linden Gate Dr
- 11107 Bradford Way Dr
- 11014 Linden Gate Dr