11035 Arden St Unit Bldg-Unit Livonia, MI 48150
Estimated Value: $328,000 - $345,102
3
Beds
2
Baths
1,566
Sq Ft
$215/Sq Ft
Est. Value
About This Home
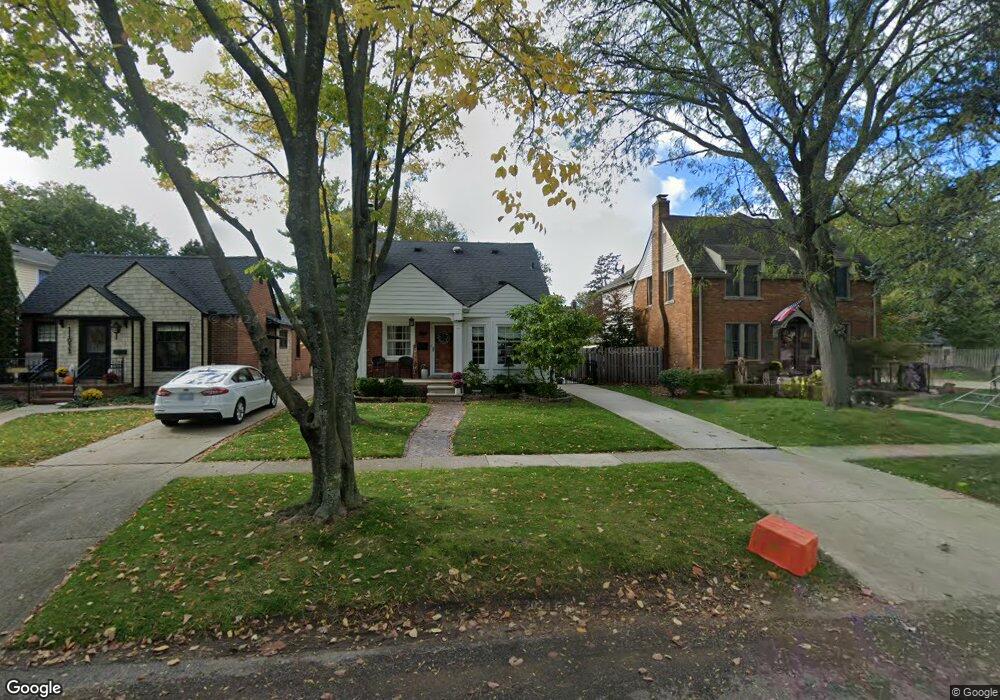
This home is located at 11035 Arden St Unit Bldg-Unit, Livonia, MI 48150 and is currently estimated at $336,026, approximately $214 per square foot. 11035 Arden St Unit Bldg-Unit is a home located in Wayne County with nearby schools including Grant Elementary School, Emerson Middle School, and Cooper Upper Elementary School.
Ownership History
Date
Name
Owned For
Owner Type
Purchase Details
Closed on
Mar 9, 2018
Sold by
Smith Evelyn Y
Bought by
Kisabeth Kelley
Current Estimated Value
Purchase Details
Closed on
Dec 9, 2013
Sold by
The Estate Of Timothy M Debellis
Bought by
Smith Evelyn Y
Purchase Details
Closed on
Apr 17, 2013
Sold by
Mallory Jason T and Mallory Meredith L
Bought by
Debellis Timothy M
Purchase Details
Closed on
Dec 8, 2010
Sold by
Mallory Jason T and Mallory Meredith L
Bought by
Mallory Jason T and Mallory Meredith L
Home Financials for this Owner
Home Financials are based on the most recent Mortgage that was taken out on this home.
Original Mortgage
$182,200
Interest Rate
4.22%
Mortgage Type
New Conventional
Purchase Details
Closed on
Apr 27, 2005
Sold by
Birmingham Todd J and Birmingham Colleen M
Bought by
Mallory Jason T
Purchase Details
Closed on
Jul 31, 1996
Sold by
Miller Daniel J
Bought by
Carmona Lee and Carmona Michele
Create a Home Valuation Report for This Property
The Home Valuation Report is an in-depth analysis detailing your home's value as well as a comparison with similar homes in the area
Home Values in the Area
Average Home Value in this Area
Purchase History
| Date | Buyer | Sale Price | Title Company |
|---|---|---|---|
| Kisabeth Kelley | $207,000 | None Available | |
| Smith Evelyn Y | $150,000 | None Available | |
| Debellis Timothy M | $166,500 | Multiple | |
| Mallory Jason T | -- | Lsi | |
| Mallory Jason T | $209,500 | Multiple | |
| Carmona Lee | $129,000 | -- |
Source: Public Records
Mortgage History
| Date | Status | Borrower | Loan Amount |
|---|---|---|---|
| Previous Owner | Mallory Jason T | $182,200 |
Source: Public Records
Tax History Compared to Growth
Tax History
| Year | Tax Paid | Tax Assessment Tax Assessment Total Assessment is a certain percentage of the fair market value that is determined by local assessors to be the total taxable value of land and additions on the property. | Land | Improvement |
|---|---|---|---|---|
| 2025 | $2,627 | $150,900 | $0 | $0 |
| 2024 | $2,627 | $139,100 | $0 | $0 |
| 2023 | $2,507 | $129,200 | $0 | $0 |
| 2022 | $4,424 | $118,000 | $0 | $0 |
| 2021 | $4,295 | $109,700 | $0 | $0 |
| 2019 | $4,115 | $101,000 | $0 | $0 |
| 2018 | $1,709 | $88,300 | $0 | $0 |
| 2017 | $3,049 | $87,600 | $0 | $0 |
| 2016 | $3,192 | $87,600 | $0 | $0 |
| 2015 | $7,698 | $80,330 | $0 | $0 |
| 2012 | -- | $63,370 | $11,400 | $51,970 |
Source: Public Records
Map
Nearby Homes
- 11016 Arden St
- 11301 Melrose St
- 11329 Merriman Rd
- 11410 Auburndale St
- 11425 Merriman Rd
- 9871 Denne St
- 9611 Melrose St
- 31600 W Chicago St
- 11015 Fairfield St
- 30720 Hathaway St
- 9253 Idaho St
- 9840 Brookfield St
- 9834 Brookfield St
- 31171 Grandon St Unit 56
- 9085 Melrose St
- 11327 Mayfield St
- 30673 Westfield St
- 31011 Grandon St
- 30408 Minton St
- 32611 Vermont St
- 11035 Arden St
- 11041 Arden St
- 11029 Arden St
- 11027 Arden St
- 11032 Melrose St
- 11040 Melrose St
- 11301 Arden St
- 11017 Arden St
- 11030 Melrose St
- 11040 Arden St
- 11034 Arden St
- 11300 Melrose St
- 11011 Arden St
- 11030 Arden St
- 11309 Arden St
- 11304 Arden St
- 11028 Arden St
- 11026 Melrose St
- 11311 Arden St
- 11310 Melrose St