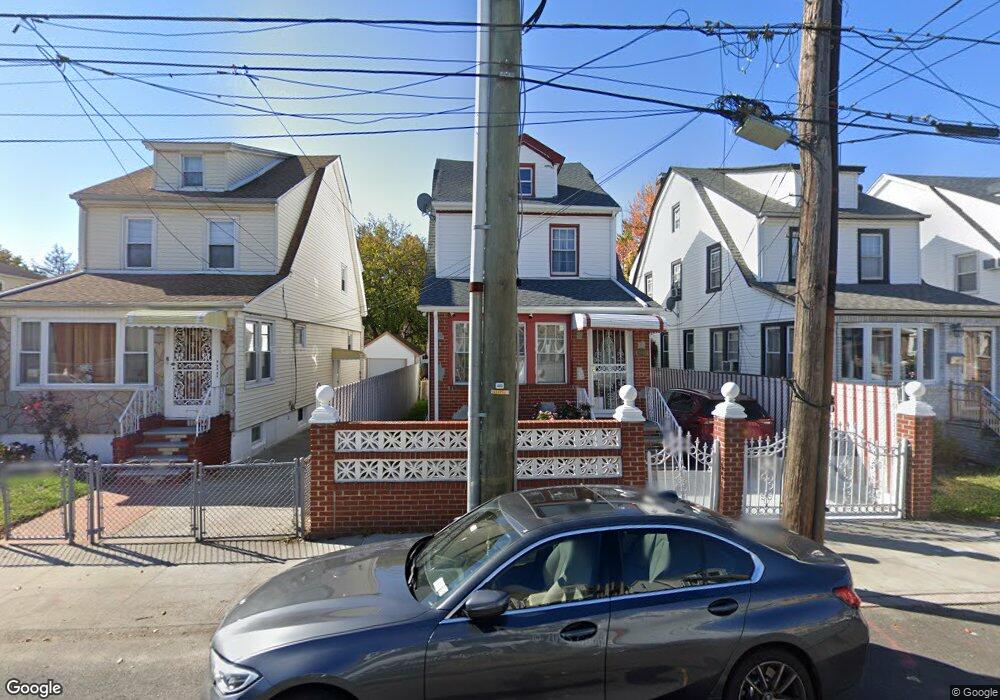
11036 178th St Jamaica, NY 11433
Jamaica NeighborhoodEstimated Value: $729,000 - $822,000
--
Bed
--
Bath
1,552
Sq Ft
$502/Sq Ft
Est. Value
About This Home
This home is located at 11036 178th St, Jamaica, NY 11433 and is currently estimated at $778,857, approximately $501 per square foot. 11036 178th St is a home located in Queens County with nearby schools including P.S./I.S. 116 William C Hughley, I.S. 238 Susan B Anthony Academy, and Allen Christian School.
Ownership History
Date
Name
Owned For
Owner Type
Purchase Details
Closed on
Aug 11, 2022
Sold by
Diallo Alpha Oumar Sankarella
Bought by
Mannan Kazi R and Sukti Mosammat S
Current Estimated Value
Home Financials for this Owner
Home Financials are based on the most recent Mortgage that was taken out on this home.
Original Mortgage
$520,600
Outstanding Balance
$497,720
Interest Rate
5.51%
Mortgage Type
Purchase Money Mortgage
Estimated Equity
$281,137
Purchase Details
Closed on
Sep 27, 2007
Sold by
Medwinter Jennifer E
Bought by
Diallo Alpha Oumar Sankarella
Home Financials for this Owner
Home Financials are based on the most recent Mortgage that was taken out on this home.
Original Mortgage
$352,000
Interest Rate
6.49%
Purchase Details
Closed on
Apr 15, 1996
Sold by
Robinson Annie
Bought by
Medwinter Jennifer E
Home Financials for this Owner
Home Financials are based on the most recent Mortgage that was taken out on this home.
Original Mortgage
$114,059
Interest Rate
7.77%
Mortgage Type
FHA
Create a Home Valuation Report for This Property
The Home Valuation Report is an in-depth analysis detailing your home's value as well as a comparison with similar homes in the area
Home Values in the Area
Average Home Value in this Area
Purchase History
| Date | Buyer | Sale Price | Title Company |
|---|---|---|---|
| Mannan Kazi R | $685,000 | -- | |
| Diallo Alpha Oumar Sankarella | $440,000 | -- | |
| Medwinter Jennifer E | $115,000 | Commonwealth Land Title Ins |
Source: Public Records
Mortgage History
| Date | Status | Borrower | Loan Amount |
|---|---|---|---|
| Open | Mannan Kazi R | $520,600 | |
| Previous Owner | Diallo Alpha Oumar Sankarella | $352,000 | |
| Previous Owner | Medwinter Jennifer E | $114,059 |
Source: Public Records
Tax History Compared to Growth
Tax History
| Year | Tax Paid | Tax Assessment Tax Assessment Total Assessment is a certain percentage of the fair market value that is determined by local assessors to be the total taxable value of land and additions on the property. | Land | Improvement |
|---|---|---|---|---|
| 2025 | $4,922 | $24,797 | $5,817 | $18,980 |
| 2024 | $4,922 | $24,504 | $6,254 | $18,250 |
| 2023 | $4,873 | $24,264 | $6,354 | $17,910 |
| 2022 | $4,570 | $36,240 | $10,260 | $25,980 |
| 2021 | $4,554 | $38,040 | $10,260 | $27,780 |
| 2020 | $4,374 | $36,300 | $10,260 | $26,040 |
| 2019 | $4,272 | $33,300 | $10,260 | $23,040 |
| 2018 | $4,122 | $20,220 | $8,843 | $11,377 |
| 2017 | $3,889 | $19,076 | $7,363 | $11,713 |
| 2016 | $3,605 | $19,076 | $7,363 | $11,713 |
| 2015 | $2,171 | $17,220 | $11,400 | $5,820 |
| 2014 | $2,171 | $17,017 | $9,594 | $7,423 |
Source: Public Records
Map
Nearby Homes
- 17718 Sayres Ave
- 177-08 Sayres Ave
- 110-40 176th St
- 10944 177th St
- 111-54 178th Place
- 17709 112th Ave
- 109-49 176th St
- 112- 2 178th St
- 110-01 175th St
- 112-13 178th St
- 11176 180th St
- 10912 176th St
- 112-26 176th St
- 112-45 178th St
- 11245 178th St
- 179-07 Murdock Ave
- 11023 172nd St
- 17210 111th Ave
- 10779 Watson Place
- 173-15 109th Ave
- 11036 178th St
- 11032 178th St
- 11038 178th St
- 11032 178th St
- 11030 178th St
- 177-25 178 St
- 11026 178th St
- 17725 Sayres Ave
- 17725 Sayres Ave
- 177-21 Sayres Ave Unit 2
- 11035 177th St
- 11033 177th St
- 17721 Sayres Ave
- 110-29 177th St
- 11039 177th St
- 11029 177th St
- 11039 177th St
- 11022 178th St
- 11041 177th St
- 11027 177th St