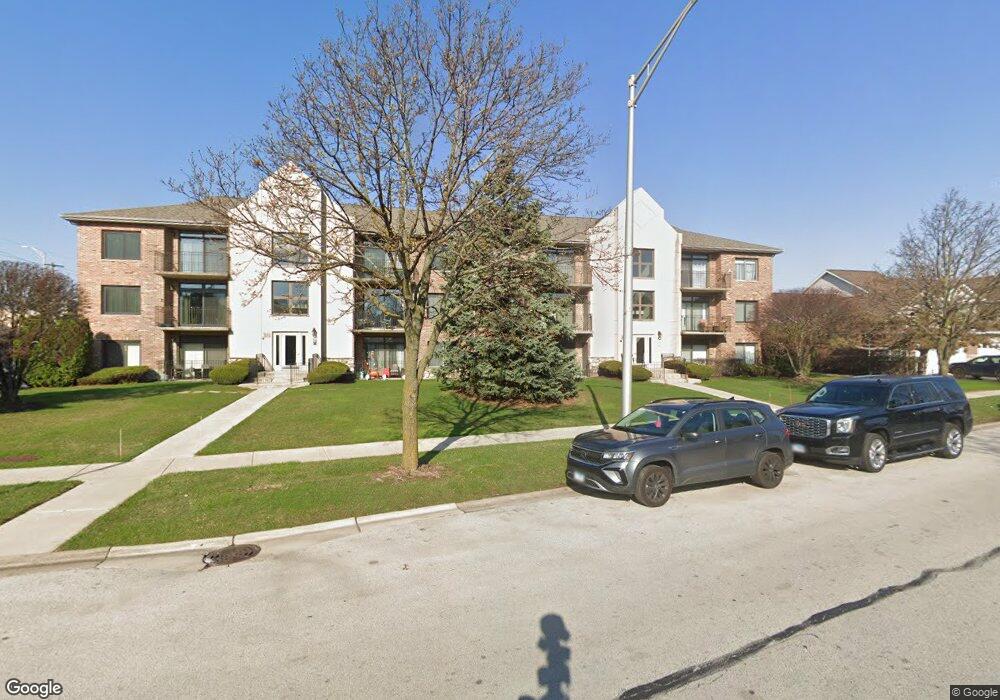
11036 Jodan Dr Unit 1C Oak Lawn, IL 60453
Estimated Value: $194,227 - $240,000
2
Beds
2
Baths
1,200
Sq Ft
$185/Sq Ft
Est. Value
About This Home
This home is located at 11036 Jodan Dr Unit 1C, Oak Lawn, IL 60453 and is currently estimated at $221,557, approximately $184 per square foot. 11036 Jodan Dr Unit 1C is a home located in Cook County with nearby schools including Stony Creek Elementary School, Prairie Jr High School, and Harold L. Richards High School.
Ownership History
Date
Name
Owned For
Owner Type
Purchase Details
Closed on
May 16, 2005
Sold by
Riccio Ruth Bovira
Bought by
Castellano Paul and Morales Geraldine A
Current Estimated Value
Home Financials for this Owner
Home Financials are based on the most recent Mortgage that was taken out on this home.
Original Mortgage
$161,500
Outstanding Balance
$85,340
Interest Rate
6.05%
Mortgage Type
Fannie Mae Freddie Mac
Estimated Equity
$136,217
Purchase Details
Closed on
Oct 22, 2002
Sold by
Olinger Ann
Bought by
Riccio Ruth Bonita
Home Financials for this Owner
Home Financials are based on the most recent Mortgage that was taken out on this home.
Original Mortgage
$70,000
Interest Rate
6.1%
Mortgage Type
Balloon
Purchase Details
Closed on
Feb 18, 1999
Sold by
Olinger Ann
Bought by
Olinger Ann and Cipolla Joseph
Purchase Details
Closed on
Nov 29, 1994
Sold by
First National Bank Of Blue Island
Bought by
Olinger Peter and Olinger Ann
Create a Home Valuation Report for This Property
The Home Valuation Report is an in-depth analysis detailing your home's value as well as a comparison with similar homes in the area
Home Values in the Area
Average Home Value in this Area
Purchase History
| Date | Buyer | Sale Price | Title Company |
|---|---|---|---|
| Castellano Paul | $186,500 | Multiple | |
| Riccio Ruth Bonita | $132,000 | -- | |
| Olinger Ann | -- | -- | |
| Olinger Peter | $119,500 | Ticor Title Insurance |
Source: Public Records
Mortgage History
| Date | Status | Borrower | Loan Amount |
|---|---|---|---|
| Open | Castellano Paul | $161,500 | |
| Previous Owner | Riccio Ruth Bonita | $70,000 |
Source: Public Records
Tax History Compared to Growth
Tax History
| Year | Tax Paid | Tax Assessment Tax Assessment Total Assessment is a certain percentage of the fair market value that is determined by local assessors to be the total taxable value of land and additions on the property. | Land | Improvement |
|---|---|---|---|---|
| 2024 | $2,408 | $13,911 | $1,325 | $12,586 |
| 2023 | $990 | $13,911 | $1,325 | $12,586 |
| 2022 | $990 | $11,938 | $1,414 | $10,524 |
| 2021 | $919 | $11,936 | $1,413 | $10,523 |
| 2020 | $851 | $11,936 | $1,413 | $10,523 |
| 2019 | $966 | $11,624 | $1,281 | $10,343 |
| 2018 | $930 | $11,624 | $1,281 | $10,343 |
| 2017 | $927 | $11,624 | $1,281 | $10,343 |
| 2016 | $2,662 | $9,681 | $1,060 | $8,621 |
| 2015 | $2,612 | $9,681 | $1,060 | $8,621 |
| 2014 | $2,570 | $9,681 | $1,060 | $8,621 |
| 2013 | $3,585 | $13,364 | $1,060 | $12,304 |
Source: Public Records
Map
Nearby Homes
- 11028 Jodan Dr
- 5120 Deblin Ln
- 11000 Deblin Ln
- 5111 Deblin Ln Unit 3B
- 11001 Deblin Ln Unit 203
- 11152 S Lawler Ave
- 10816 Leclaire Ave
- 10720 Laramie Ave
- 4917 W 109th St Unit 202
- 10737 Long Ave
- 10724 Lawler Ave
- 10652 Laramie Ave
- 4829 W 109th St Unit 203
- 11010 Central Ave Unit 3A
- 11000 Central Ave Unit 2C
- 10713 Lawler Ave
- 10930 Central Ave Unit 1B
- 5128 W 113th St
- 5311 W Mint Julip Dr Unit 301
- 10624 Lawler Ave
- 11036 Jodan Dr Unit G1311
- 11036 Jodan Dr Unit 110362
- 11036 Jodan Dr Unit G139
- 11036 Jodan Dr Unit 110363
- 11036 Jodan Dr Unit 110362
- 11036 Jodan Dr Unit G137
- 11036 Jodan Dr Unit 2D
- 11036 Jodan Dr Unit 1D
- 11032 Jodan Dr
- 11040 Jodan Dr Unit 1B
- 11040 Jodan Dr Unit 3A
- 11040 Jodan Dr
- 11040 Jodan Dr Unit 110401
- 11040 Jodan Dr Unit 110401
- 11040 Jodan Dr Unit 3B
- 11040 Jodan Dr Unit 3A
- 11040 Jodan Dr Unit 110402
- 11040 Jodan Dr Unit 2A
- 11040 Jodan Dr Unit G135
- 11040 Jodan Dr Unit G134