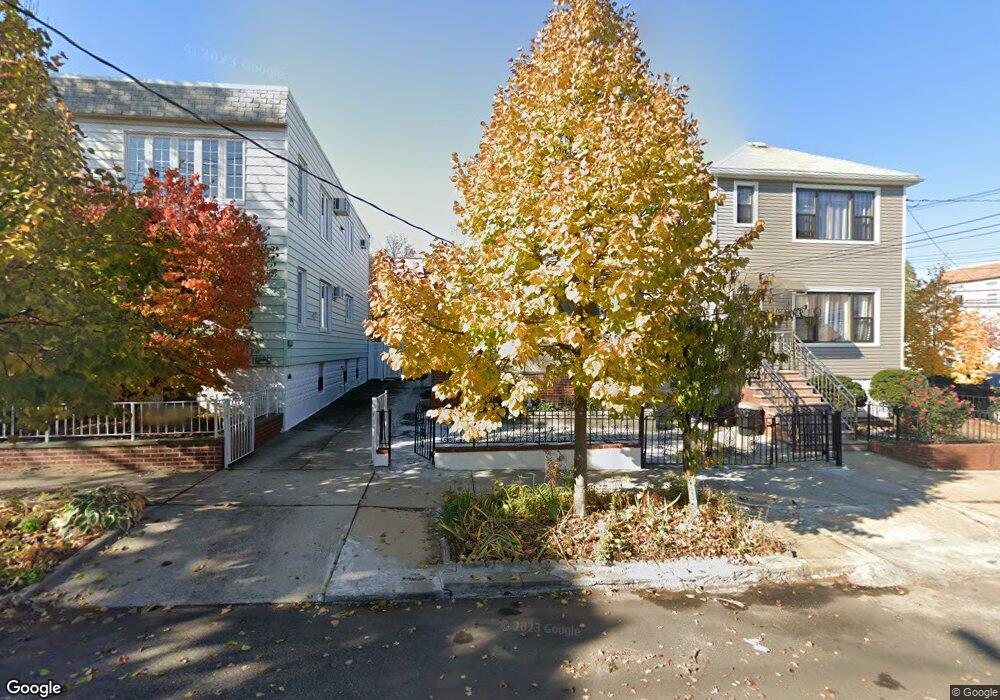
1104 125th St College Point, NY 11356
College Point NeighborhoodEstimated Value: $714,000 - $784,000
--
Bed
--
Bath
900
Sq Ft
$819/Sq Ft
Est. Value
About This Home
This home is located at 1104 125th St, College Point, NY 11356 and is currently estimated at $736,768, approximately $818 per square foot. 1104 125th St is a home located in Queens County with nearby schools including P.S. 129 Patricia Larkin, J.H.S. 194 William Carr, and Flushing High School.
Ownership History
Date
Name
Owned For
Owner Type
Purchase Details
Closed on
Jan 31, 2023
Sold by
Yip Fong Hermia Kwan Mei and Yip Fong Kwan
Bought by
Zheng Bing Run and Zheng Xingyi
Current Estimated Value
Home Financials for this Owner
Home Financials are based on the most recent Mortgage that was taken out on this home.
Original Mortgage
$314,250
Outstanding Balance
$304,029
Interest Rate
6.13%
Mortgage Type
Purchase Money Mortgage
Estimated Equity
$432,739
Purchase Details
Closed on
Nov 6, 2010
Sold by
Yip Kwan Mei Fong and Yip Wai Shing
Bought by
Fong Hermia Kwan Mei Yip and Yip Ho Pun
Home Financials for this Owner
Home Financials are based on the most recent Mortgage that was taken out on this home.
Original Mortgage
$81,228
Interest Rate
4.22%
Mortgage Type
Purchase Money Mortgage
Purchase Details
Closed on
Apr 15, 1998
Sold by
Lai Kwok Tai and Lai Siu Wing
Bought by
Yip Wai Shing and Yip Kwan Mei Fong
Home Financials for this Owner
Home Financials are based on the most recent Mortgage that was taken out on this home.
Original Mortgage
$90,000
Interest Rate
7.03%
Create a Home Valuation Report for This Property
The Home Valuation Report is an in-depth analysis detailing your home's value as well as a comparison with similar homes in the area
Home Values in the Area
Average Home Value in this Area
Purchase History
| Date | Buyer | Sale Price | Title Company |
|---|---|---|---|
| Zheng Bing Run | $628,500 | -- | |
| Fong Hermia Kwan Mei Yip | -- | -- | |
| Yip Wai Shing | $142,000 | American Title Ins Co |
Source: Public Records
Mortgage History
| Date | Status | Borrower | Loan Amount |
|---|---|---|---|
| Open | Zheng Bing Run | $314,250 | |
| Previous Owner | Fong Hermia Kwan Mei Yip | $81,228 | |
| Previous Owner | Yip Wai Shing | $90,000 |
Source: Public Records
Tax History Compared to Growth
Tax History
| Year | Tax Paid | Tax Assessment Tax Assessment Total Assessment is a certain percentage of the fair market value that is determined by local assessors to be the total taxable value of land and additions on the property. | Land | Improvement |
|---|---|---|---|---|
| 2025 | $6,217 | $31,956 | $7,018 | $24,938 |
| 2024 | $6,217 | $30,954 | $6,991 | $23,963 |
| 2023 | $5,872 | $29,237 | $6,575 | $22,662 |
| 2022 | $5,579 | $44,580 | $9,540 | $35,040 |
| 2021 | $5,610 | $41,040 | $9,540 | $31,500 |
| 2020 | $5,637 | $36,240 | $9,540 | $26,700 |
| 2019 | $5,396 | $34,860 | $9,540 | $25,320 |
| 2018 | $4,967 | $24,364 | $5,705 | $18,659 |
| 2017 | $4,747 | $23,288 | $6,857 | $16,431 |
| 2016 | $4,441 | $23,288 | $6,857 | $16,431 |
| 2015 | $2,430 | $22,192 | $7,872 | $14,320 |
| 2014 | $2,430 | $21,496 | $7,894 | $13,602 |
Source: Public Records
Map
Nearby Homes
- 125-03 13th Ave
- 126-08 9th Ave
- 12401 9th Ave
- 13-19 126th St
- 10-3 127th St
- 13-25 126th St
- 9-24 College Point Blvd
- 11-20 128th St
- 724 125th St
- 9-03 127th St
- 939 College Place
- 9-01 127th St
- 125-19 14th Ave
- 1314 College Point Blvd
- 7-12 125th St
- 7-11 123rd St
- 3 Beech Court Cir
- 121-16 8th Ave
- 123-19 7th Ave
- 14-21 121st St
- 1102 125th St Unit 1
- 1102 125th St Unit 1Fl
- 1102 125th St
- 1106 125th St
- 11-16 125th St
- 11-06 125th St Unit 1
- 11-04 125th St
- 1110 125th St
- 12412 11th Ave
- 11-02 125th St
- 1110 125th St Unit 2Fl
- 1110 125th St
- 1110 125th St Unit 2FL
- 12410 11th Ave
- 1114 125th St
- 12408 11th Ave
- 124-08 11th Ave
- 12406 11th Ave
- 12406 11th Ave
- 12404 11th Ave