Estimated payment $3,464/month
Highlights
- Popular Property
- View of Trees or Woods
- Deck
- Baucom Elementary School Rated A
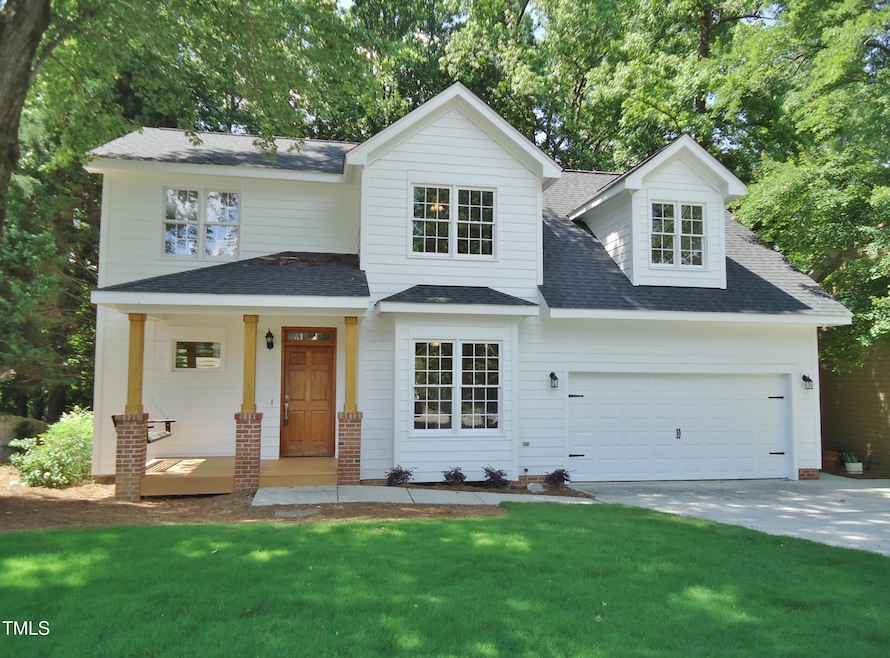
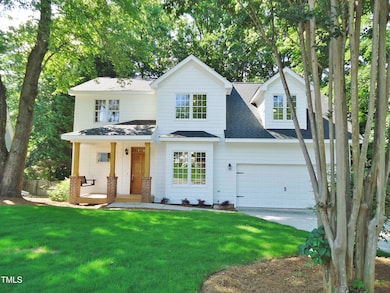
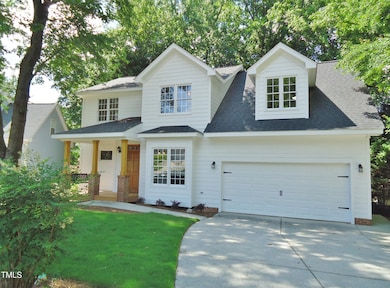
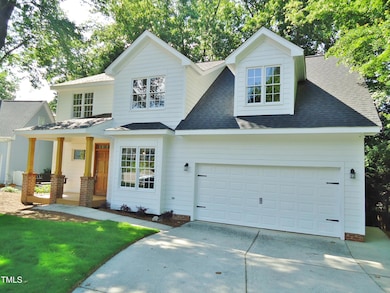
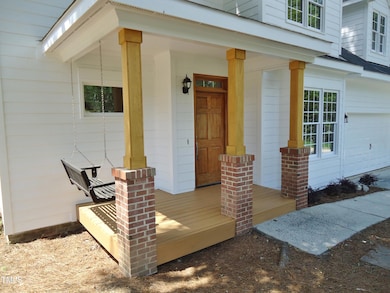
- Craftsman Architecture
- Partially Wooded Lot
About This Home
Welcome to the ''Peak of Good Living'' in this beautifully updated cul-de-sac home. Minutes to downtown Apex and 540. The new roof, updated kitchen and bathrooms leave nothing to do but move in and enjoy. New carpet, refinished hardwoods, 0pen floor plan with loft and private back yard are just the beginning of what you will love about this home. The community pool, town greenway, great restaurants, parks and schools are just right around the corner and the Apex Peakway expansion will make getting in and out even easier. The pictures don't do it justice. Come quick before it's too late.
Home Details
Home Type
- Single Family
Est. Annual Taxes
- $4,474
Year Built
- Built in 2000 | Remodeled
Lot Details
- 8,559 Sq Ft Lot
- Lot Dimensions are 75x113x75x114
- Cul-De-Sac
- Landscaped
- Partially Wooded Lot
- Property is zoned MD_CU
HOA Fees
- $35 Monthly HOA Fees
Parking
- 2 Car Attached Garage
- Front Facing Garage
- Garage Door Opener
- 2 Open Parking Spaces
Home Design
- Craftsman Architecture
- Brick Foundation
- Architectural Shingle Roof
Interior Spaces
- 2,050 Sq Ft Home
- 2-Story Property
- Smooth Ceilings
- High Ceiling
- Ceiling Fan
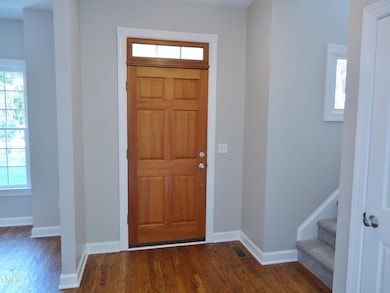
- Entrance Foyer
- Living Room
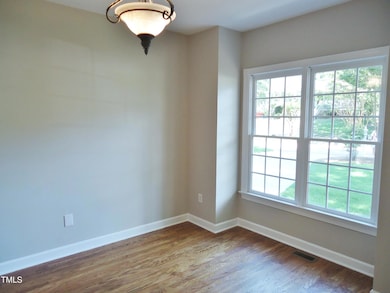
- Breakfast Room
- Dining Room
- Loft
- Views of Woods
- Basement
- Crawl Space
- Pull Down Stairs to Attic
Kitchen
- Breakfast Bar
- Electric Range
- Microwave
- Dishwasher
- Stainless Steel Appliances
- Granite Countertops
- Disposal
Flooring
- Wood
- Carpet
- Luxury Vinyl Tile
Bedrooms and Bathrooms
- 3 Bedrooms
- Primary bedroom located on second floor
- Walk-In Closet
- Double Vanity
- Private Water Closet
- Separate Shower in Primary Bathroom
- Separate Shower
Laundry
- Laundry Room
- Laundry on main level
- Sink Near Laundry
Outdoor Features
- Deck
- Covered Patio or Porch
Schools
- Baucom Elementary School
- Apex Middle School
- Apex High School
Utilities
- Cooling System Powered By Gas
- Forced Air Heating and Cooling System
- Heating System Uses Gas
- Heating System Uses Natural Gas
- Natural Gas Connected
- Electric Water Heater
- Cable TV Available
Listing and Financial Details
- Home warranty included in the sale of the property
- Assessor Parcel Number 115
Community Details
Overview
- Whitehall Manor HOA, Phone Number (919) 787-9000
- Built by BRG
- Whitehall Manor Subdivision, Centennial Floorplan
Recreation
- Community Playground
- Community Pool
Map
Home Values in the Area
Average Home Value in this Area
Tax History
| Year | Tax Paid | Tax Assessment Tax Assessment Total Assessment is a certain percentage of the fair market value that is determined by local assessors to be the total taxable value of land and additions on the property. | Land | Improvement |
|---|---|---|---|---|
| 2025 | $4,474 | $510,151 | $190,000 | $320,151 |
| 2024 | $4,374 | $510,151 | $190,000 | $320,151 |
| 2023 | $3,469 | $314,391 | $60,000 | $254,391 |
| 2022 | $3,257 | $314,391 | $60,000 | $254,391 |
| 2021 | $3,132 | $314,391 | $60,000 | $254,391 |
| 2020 | $3,101 | $314,391 | $60,000 | $254,391 |
| 2019 | $3,083 | $269,670 | $60,000 | $209,670 |
| 2018 | $2,904 | $269,670 | $60,000 | $209,670 |
| 2017 | $2,703 | $269,670 | $60,000 | $209,670 |
| 2016 | $2,664 | $269,670 | $60,000 | $209,670 |
| 2015 | $2,570 | $253,812 | $52,000 | $201,812 |
| 2014 | -- | $253,812 | $52,000 | $201,812 |
Property History
| Date | Event | Price | List to Sale | Price per Sq Ft |
|---|---|---|---|---|
| 11/08/2025 11/08/25 | For Sale | $579,900 | -- | $283 / Sq Ft |
Purchase History
| Date | Type | Sale Price | Title Company |
|---|---|---|---|
| Warranty Deed | $180,000 | -- | |
| Warranty Deed | $32,000 | -- |
Mortgage History
| Date | Status | Loan Amount | Loan Type |
|---|---|---|---|
| Open | $143,200 | No Value Available | |
| Previous Owner | $27,000 | No Value Available | |
| Closed | $5,000 | No Value Available | |
| Closed | $26,500 | No Value Available |
Source: Doorify MLS
MLS Number: 10132149
APN: 0731.08-97-6821-000
Disclaimer: Certain information contained herein is derived from information provided by parties other than Homes.com. All information provided is deemed reliable, but is not guaranteed to be accurate and should be independently verified.
![]() Some IDX listings have been excluded from this IDX display. Brokers make an effort to deliver accurate information, but buyers should independently verify any information on which they will rely in a transaction. The listing broker shall not be responsible for any typographical errors, misinformation, or misprints, and they shall be held totally harmless from any damages arising from reliance upon this data. This data is provided exclusively for consumers’ personal, non-commercial use. Listings marked with an icon are provided courtesy of the Doorify MLS, Inc. of North Carolina, Internet Data Exchange Database. Closed (sold) listings may have been listed and/or sold by a real estate firm other than the firm(s) featured on this website. Closed data is not available until the sale of the property is recorded in the MLS. Home sale data is not an appraisal, CMA, competitive or comparative market analysis, or home valuation of any property. Copyright 2025 Doorify MLS, Inc. of North Carolina. All rights reserved.
Some IDX listings have been excluded from this IDX display. Brokers make an effort to deliver accurate information, but buyers should independently verify any information on which they will rely in a transaction. The listing broker shall not be responsible for any typographical errors, misinformation, or misprints, and they shall be held totally harmless from any damages arising from reliance upon this data. This data is provided exclusively for consumers’ personal, non-commercial use. Listings marked with an icon are provided courtesy of the Doorify MLS, Inc. of North Carolina, Internet Data Exchange Database. Closed (sold) listings may have been listed and/or sold by a real estate firm other than the firm(s) featured on this website. Closed data is not available until the sale of the property is recorded in the MLS. Home sale data is not an appraisal, CMA, competitive or comparative market analysis, or home valuation of any property. Copyright 2025 Doorify MLS, Inc. of North Carolina. All rights reserved.
- 1004 Marston Ct
- 1407 Grappenhall Dr
- 1103 Churchwood Dr
- 1464 Padstone Dr
- 1614 Brussels Dr
- 1787 Flint Valley Ln
- 111 Gumdrop Path
- 103 Garden Side Way
- 0 Jb Morgan Rd Unit 10051948
- 209 Homegate Cir
- 1415 Regents Ln
- 1434 Salem Creek Dr
- 305 Justice Heights St
- 1844 Woodall Crest Dr
- 1059 Torrence Dr
- 1706 Burgundy Park Dr
- 541 Village Loop Dr
- 304 Baucom St
- 460 Heritage Village Ln
- 0-2932 Tingen Rd
- 303 Linwood St Unit 302
- 303 Linwood St Unit 306
- 303 Linwood St Unit 303
- 303 Linwood St Unit 301
- 102 Milky Way Dr
- 30000 Summer Crop Ln
- 1434 Salem Creek Dr
- 568 Village Loop Dr
- 1884 Sweet Gardenia Way
- 1821 Chatham Flats Dr
- 1821 Chatham Flats Dr Unit C1
- 1821 Chatham Flats Dr Unit B2
- 1821 Chatham Flats Dr Unit A1
- 747 Goldenview Acres Ct
- 1753 Aspen River Ln
- 1765 Aspen River Ln
- 1811 Aspen River Ln
- 501 W Chatham St
- 1705 Barrett Run Trail
- 200 E Moore St Unit D
