
Seller's Agent in 2021
MARY HALEY
Pearson Smith Realty LLC
(877) 840-0144
2 in this area
38 Total Sales


Estimated Value: $1,015,000 - $1,086,000
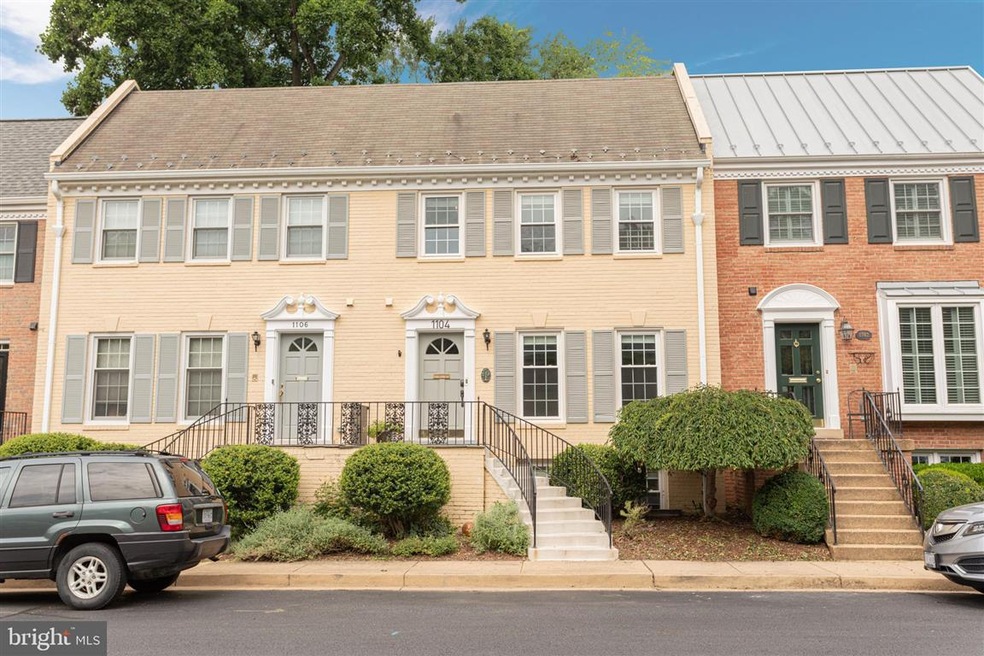
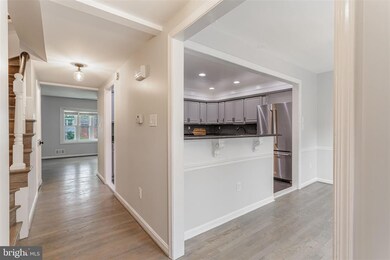
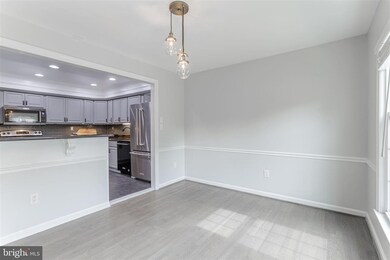
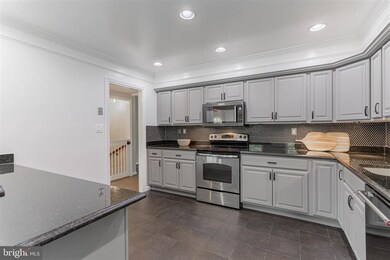
Rare opportunity in McLean’s Kings Manor community! Beautifully renovated 4-bedroom, 3.5 bath townhouse available immediately. Bright and spacious, this stunning townhouse contains countless upgrades and renovations including: newly updated bathrooms, fresh paint throughout, refinished hardwood flooring, new windows with genuine wood leveler darkening blinds customized for every window and basement door, as well as an updated kitchen with new flooring, backsplash, and new appliances. The main level of this impressive home features an oversized kitchen with a dining room, a formal living room accented by a fireplace with convenient built-in bookshelves and a powder room. The upper level includes an updated hall bathroom and generously sized bedrooms. The owner’s suite contains a new en-suite bathroom and an abundance of closet space. The fully finished lower level has an additional bedroom, perfect for a home office, as well as a full bathroom and laundry room. In addition, the bright walk out lower level features a wonderful recreation room with a small wet bar. The lower-level space is complemented by lovely French doors and double paned windows. The rear yard contains a cozy, enchanting private back patio. The property is perfectly situated just blocks from the heart of McLean and with easy access to all major commuter routes, including 495, Rt 66, the Toll Road and GW parkway.
Last Agent to Rent the Property
(703) 319-3344 twilliams@ttrsir.com TTR Sothebys International Realty Listed on: 07/09/2021
Co-Listed By
Elizabeth Gensler
lgensler@ttrsir.com TTR Sothebys International Realty License #0225252002
Last Renter's Agent
(703) 622-0312 galaxyrealty.com@gmail.com Galaxy Realty LLC License #0225081066
| Date | Buyer | Sale Price | Title Company |
|---|---|---|---|
| Rowland Advisors Llc | $850,000 | Allied Title & Escrow Llc | |
| Johnson Fanny | $740,000 | Centerview Title Group Llc | |
| Bong Sun Anh Trust | -- | None Available |
| Date | Status | Borrower | Loan Amount |
|---|---|---|---|
| Previous Owner | Johnson Fanny | $460,000 |
| Date | Event | Price | List to Sale | Price per Sq Ft | Prior Sale |
|---|---|---|---|---|---|
| 07/21/2021 07/21/21 | Rented | $4,000 | 0.0% | -- | |
| 07/21/2021 07/21/21 | Under Contract | -- | -- | -- | |
| 07/21/2021 07/21/21 | For Rent | $4,000 | 0.0% | -- | |
| 07/13/2021 07/13/21 | Under Contract | -- | -- | -- | |
| 07/09/2021 07/09/21 | For Rent | $4,000 | 0.0% | -- | |
| 06/14/2021 06/14/21 | Sold | $850,000 | -1.7% | $547 / Sq Ft | View Prior Sale |
| 05/01/2021 05/01/21 | Pending | -- | -- | -- | |
| 04/13/2021 04/13/21 | For Sale | $865,000 | +16.9% | $557 / Sq Ft | |
| 12/24/2019 12/24/19 | Sold | $740,000 | -1.2% | $476 / Sq Ft | View Prior Sale |
| 11/26/2019 11/26/19 | Pending | -- | -- | -- | |
| 11/26/2019 11/26/19 | Price Changed | $749,000 | 0.0% | $482 / Sq Ft | |
| 11/26/2019 11/26/19 | For Sale | $749,000 | +1.2% | $482 / Sq Ft | |
| 11/18/2019 11/18/19 | Off Market | $740,000 | -- | -- | |
| 11/15/2019 11/15/19 | For Sale | $750,000 | +1.4% | $483 / Sq Ft | |
| 11/11/2019 11/11/19 | Off Market | $740,000 | -- | -- | |
| 10/11/2019 10/11/19 | Price Changed | $759,900 | -1.3% | $489 / Sq Ft | |
| 10/07/2019 10/07/19 | Price Changed | $769,900 | -1.3% | $495 / Sq Ft | |
| 09/24/2019 09/24/19 | For Sale | $779,900 | -- | $502 / Sq Ft |
| Year | Tax Paid | Tax Assessment Tax Assessment Total Assessment is a certain percentage of the fair market value that is determined by local assessors to be the total taxable value of land and additions on the property. | Land | Improvement |
|---|---|---|---|---|
| 2025 | $11,270 | $964,960 | $440,000 | $524,960 |
| 2023 | $10,011 | $869,410 | $360,000 | $509,410 |
| 2022 | $9,459 | $810,860 | $310,000 | $500,860 |
| 2021 | $9,312 | $778,270 | $305,000 | $473,270 |
| 2020 | $8,895 | $737,230 | $270,000 | $467,230 |
| 2019 | $8,692 | $720,450 | $258,000 | $462,450 |
| 2018 | $8,064 | $701,240 | $258,000 | $443,240 |
| 2017 | $8,230 | $695,090 | $253,000 | $442,090 |
| 2016 | $8,037 | $680,270 | $248,000 | $432,270 |
Seller's Agent in 2021
MARY HALEY
Pearson Smith Realty LLC
(877) 840-0144
2 in this area
38 Total Sales
Landlord's Agent in 2021
Tracy Williams
TTR Sotheby's International Realty
(703) 867-4309
33 in this area
56 Total Sales
E
Landlord's Co-Listing Agent in 2021
Elizabeth Gensler
TTR Sotheby's International Realty
L
Tenant's Agent in 2021
Lori Jung
Galaxy Realty LLC
(703) 622-7120
20 in this area
79 Total Sales
J
Seller's Agent in 2019
Jane Han
Samson Properties
(703) 568-8501
6 Total Sales
Seller Co-Listing Agent in 2019
Jay Noh
Samson Properties
(703) 507-8802
46 Total Sales
Source: Bright MLS
MLS Number: VAFX2004000
APN: 0214-16-0052
Disclaimer: Certain information contained herein is derived from information provided by parties other than Homes.com. All information provided is deemed reliable, but is not guaranteed to be accurate and should be independently verified.
![]() The data relating to real estate for sale on this website appears in part through the BRIGHT Internet Data Exchange program, a voluntary cooperative exchange of property listing data between licensed real estate brokerage firms, and is provided by BRIGHT through a licensing agreement.
The data relating to real estate for sale on this website appears in part through the BRIGHT Internet Data Exchange program, a voluntary cooperative exchange of property listing data between licensed real estate brokerage firms, and is provided by BRIGHT through a licensing agreement.
Listing information is from various brokers who participate in the Bright MLS IDX program and not all listings may be visible on the site.
The property information being provided on or through the website is for the personal, non-commercial use of consumers and such information may not be used for any purpose other than to identify prospective properties consumers may be interested in purchasing.
Some properties which appear for sale on the website may no longer be available because they are for instance, under contract, sold or are no longer being offered for sale.
Property information displayed is deemed reliable but is not guaranteed.
Copyright 2026 Bright MLS, Inc.
Ask me questions while you tour the home.