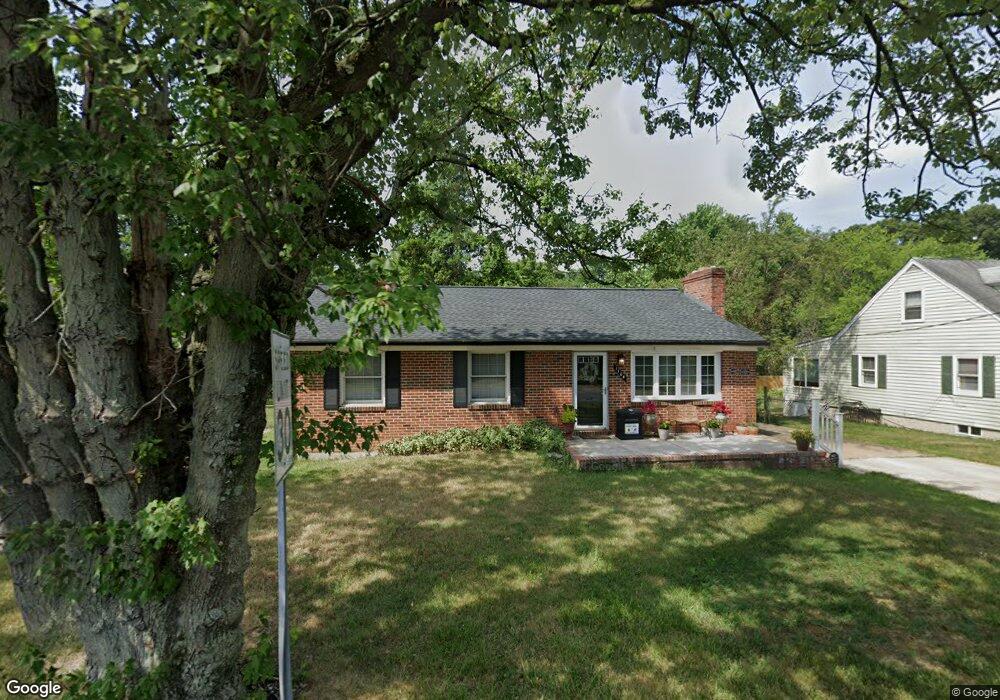
1104 Broadview Blvd N Glen Burnie, MD 21061
Estimated Value: $363,189 - $379,000
--
Bed
1
Bath
1,040
Sq Ft
$359/Sq Ft
Est. Value
About This Home
This home is located at 1104 Broadview Blvd N, Glen Burnie, MD 21061 and is currently estimated at $373,047, approximately $358 per square foot. 1104 Broadview Blvd N is a home located in Anne Arundel County with nearby schools including Lindale Middle School, North County High School, and St. Philip Neri Elementary School.
Ownership History
Date
Name
Owned For
Owner Type
Purchase Details
Closed on
Jun 27, 2005
Sold by
Thomas Brian
Bought by
Lacey Cosilyn L
Current Estimated Value
Home Financials for this Owner
Home Financials are based on the most recent Mortgage that was taken out on this home.
Original Mortgage
$276,040
Outstanding Balance
$147,709
Interest Rate
6.05%
Mortgage Type
New Conventional
Estimated Equity
$225,338
Purchase Details
Closed on
Mar 3, 2004
Sold by
Perina Michele R
Bought by
Thomas Brian and Thomas Donna
Purchase Details
Closed on
Dec 31, 2002
Sold by
Ganong Frederick R
Bought by
Perina Michele R
Purchase Details
Closed on
Jun 17, 1994
Sold by
Knott Daniel W
Bought by
Ganong Fredrick R
Home Financials for this Owner
Home Financials are based on the most recent Mortgage that was taken out on this home.
Original Mortgage
$99,850
Interest Rate
8.5%
Create a Home Valuation Report for This Property
The Home Valuation Report is an in-depth analysis detailing your home's value as well as a comparison with similar homes in the area
Home Values in the Area
Average Home Value in this Area
Purchase History
| Date | Buyer | Sale Price | Title Company |
|---|---|---|---|
| Lacey Cosilyn L | $268,000 | -- | |
| Thomas Brian | -- | -- | |
| Perina Michele R | $165,000 | -- | |
| Ganong Fredrick R | $100,000 | -- |
Source: Public Records
Mortgage History
| Date | Status | Borrower | Loan Amount |
|---|---|---|---|
| Open | Lacey Cosilyn L | $276,040 | |
| Previous Owner | Ganong Fredrick R | $99,850 |
Source: Public Records
Tax History Compared to Growth
Tax History
| Year | Tax Paid | Tax Assessment Tax Assessment Total Assessment is a certain percentage of the fair market value that is determined by local assessors to be the total taxable value of land and additions on the property. | Land | Improvement |
|---|---|---|---|---|
| 2025 | $2,840 | $270,800 | $146,800 | $124,000 |
| 2024 | $2,840 | $255,600 | $0 | $0 |
| 2023 | $2,274 | $240,400 | $0 | $0 |
| 2022 | $2,553 | $225,200 | $126,800 | $98,400 |
| 2021 | $2,430 | $220,867 | $0 | $0 |
| 2020 | $2,430 | $216,533 | $0 | $0 |
| 2019 | $2,392 | $212,200 | $116,800 | $95,400 |
| 2018 | $2,126 | $209,700 | $0 | $0 |
| 2017 | $2,262 | $207,200 | $0 | $0 |
| 2016 | -- | $204,700 | $0 | $0 |
| 2015 | -- | $204,367 | $0 | $0 |
| 2014 | -- | $204,033 | $0 | $0 |
Source: Public Records
Map
Nearby Homes
- 38 Glendale Ave
- 133 Glendale Ave
- 224 Maple Ave
- 417 Elm Ave
- 732 Winton Ave
- 104 Elm Ave
- 7121 Baltimore Annapolis Blvd
- 400 Broadview Blvd N
- 401 Forest View Rd
- 306 S Camp Meade Rd
- 304 S Camp Meade Rd
- 112 S Camp Meade Rd
- 331 E Maple Rd
- 102 Catalpa Rd
- 701 E Maple Rd
- 536 Forest View Rd
- 5722 Howard Dr
- 5737 Howard Dr
- 504 Cleveland Rd
- Lana Plan at Enclave at Arundel Hills
- 1102 Broadview Blvd N
- 1106 Broadview Blvd N
- 103 Linwood Ave
- 1100 Broadview Blvd N
- 104 Glendale Ave
- 0 Glendale Ave
- 19 Linwood Ave
- 110 Glendale Ave
- 106 Linwood Ave
- 112 Glendale Ave
- 1105 Broadview Blvd N
- 1012 Broadview Blvd N
- 1208 Broadview Blvd N
- 1103 Broadview Blvd N
- 1107 Broadview Blvd N
- 108 Linwood Ave
- 1101 Broadview Blvd N
- 107 Glendale Ave
- 1010 Broadview Blvd N
- 1210 Broadview Blvd N