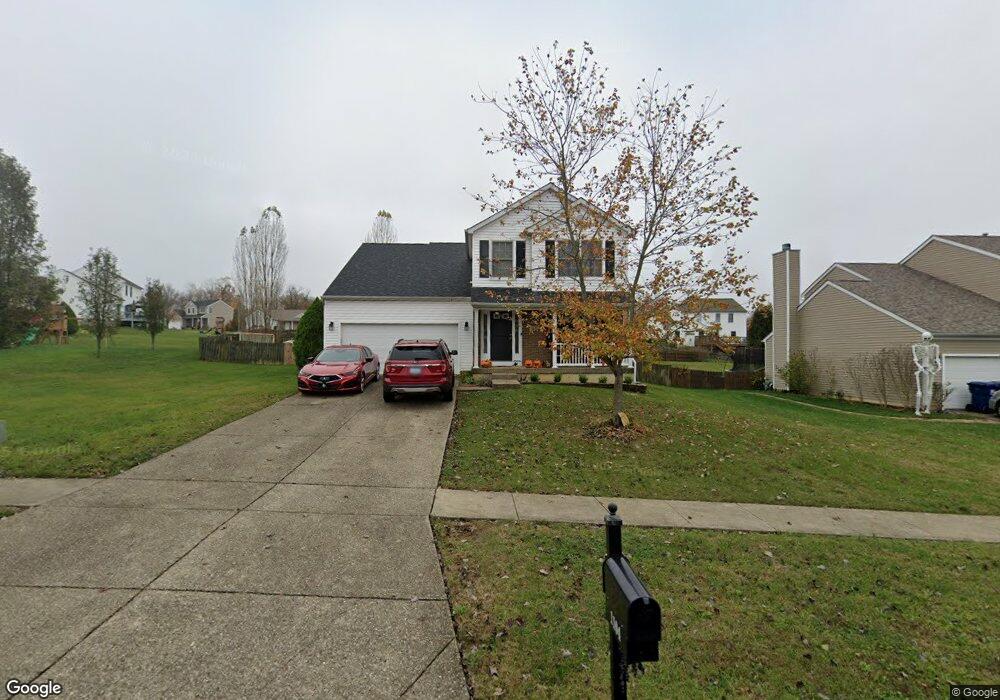
1104 Cherry Ridge Run La Grange, KY 40031
Estimated Value: $362,138 - $385,000
4
Beds
3
Baths
1,923
Sq Ft
$195/Sq Ft
Est. Value
About This Home
This home is located at 1104 Cherry Ridge Run, La Grange, KY 40031 and is currently estimated at $375,035, approximately $195 per square foot. 1104 Cherry Ridge Run is a home located in Oldham County with nearby schools including Locust Grove Elementary School, East Oldham Middle School, and Oldham County High School.
Ownership History
Date
Name
Owned For
Owner Type
Purchase Details
Closed on
Jun 3, 2016
Sold by
Benaly Lemberott and Benalyouldmohamed Jennifer
Bought by
Jurado Eduardo X and Jurado Erica Jones
Current Estimated Value
Home Financials for this Owner
Home Financials are based on the most recent Mortgage that was taken out on this home.
Original Mortgage
$216,997
Outstanding Balance
$177,224
Interest Rate
4.4%
Mortgage Type
FHA
Estimated Equity
$197,811
Purchase Details
Closed on
Mar 22, 2010
Sold by
Volz Veronica and Volz Richard
Bought by
Benaly Lemberott and Benaly Lemrabott
Home Financials for this Owner
Home Financials are based on the most recent Mortgage that was taken out on this home.
Original Mortgage
$145,502
Interest Rate
4.87%
Mortgage Type
FHA
Purchase Details
Closed on
Mar 15, 2007
Sold by
Hughes Tina M
Bought by
Secretary Of Hud
Create a Home Valuation Report for This Property
The Home Valuation Report is an in-depth analysis detailing your home's value as well as a comparison with similar homes in the area
Home Values in the Area
Average Home Value in this Area
Purchase History
| Date | Buyer | Sale Price | Title Company |
|---|---|---|---|
| Jurado Eduardo X | $221,000 | Attorney | |
| Benaly Lemberott | $153,000 | None Available | |
| Benaly Lemberott | $153,000 | None Available | |
| Secretary Of Hud | $141,000 | None Available |
Source: Public Records
Mortgage History
| Date | Status | Borrower | Loan Amount |
|---|---|---|---|
| Open | Jurado Eduardo X | $216,997 | |
| Previous Owner | Benaly Lemberott | $145,502 |
Source: Public Records
Tax History Compared to Growth
Tax History
| Year | Tax Paid | Tax Assessment Tax Assessment Total Assessment is a certain percentage of the fair market value that is determined by local assessors to be the total taxable value of land and additions on the property. | Land | Improvement |
|---|---|---|---|---|
| 2024 | $2,901 | $235,000 | $35,000 | $200,000 |
| 2023 | $2,965 | $235,000 | $35,000 | $200,000 |
| 2022 | $2,950 | $235,000 | $35,000 | $200,000 |
| 2021 | $2,931 | $235,000 | $35,000 | $200,000 |
| 2020 | $2,938 | $235,000 | $35,000 | $200,000 |
| 2019 | $2,740 | $221,000 | $35,000 | $186,000 |
| 2018 | $2,741 | $221,000 | $0 | $0 |
| 2017 | $2,722 | $221,000 | $0 | $0 |
| 2013 | $1,670 | $152,000 | $35,000 | $117,000 |
Source: Public Records
Map
Nearby Homes
- 2027 Cherrywood Dr
- 2017 Cherrywood Dr
- 1004 Richwood Way
- 2020 Cherry Creek Rd
- 2600 Sunningdale Place E
- 1606 Mahogany Run Dr
- 1716 Mahogany Run Dr
- 1911 Cherry Glen Dr
- 3019 Aiken Back Ln
- 1828 Bass Cir
- 1603 Pleasure Cove
- 2129 Aiken Back Ln
- 2123 Aiken Back Ln
- 1832 Bass Cir
- 1823 Bass Cir
- 1208 Lakewood Dr
- 3017 Aiken Back Ln
- 4027 White Pine Ln
- 7 Clifford Ln
- 1625 Tina Ct
- 2100 Cherrywood Dr
- 2102 Cherrywood Dr
- 1102 Cherry Ridge Run
- 1109 Cherrywood Ct
- 1111 Cherrywood Ct
- 1100 Cherry Ridge Run
- 1109 Cherrywood Dr
- 1107 Cherrywood Ct
- 1103 Cherry Ridge Run
- 1101 Cherry Ridge Run
- 2104 Cherrywood Dr
- 1105 Cherry Ridge Run
- 1016 Cherry Ridge Ct
- 1016 Cherry Ridge Run
- 1105 Cherrywood Ct
- 2006 Walnutwood Ct
- 2005 Walnutwood Ct
- 2022 Cherrywood Dr
- 1126 Cherrywood Ct
- 2101 Cherrywood Dr