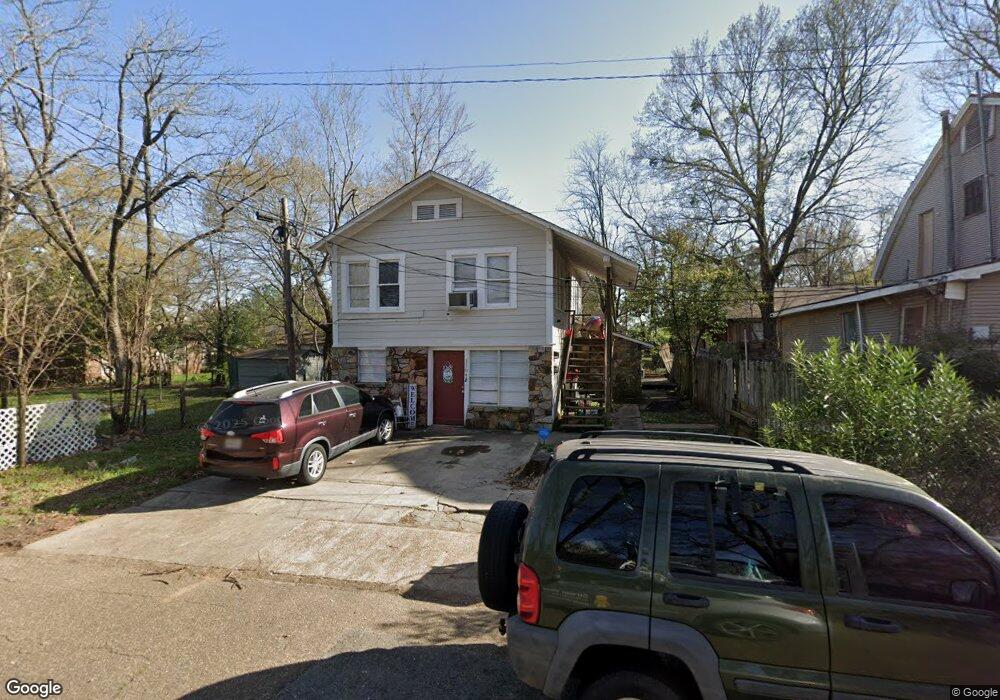
1104 E 13th St Texarkana, AR 71854
Estimated Value: $78,668 - $117,000
Studio
2
Baths
1,392
Sq Ft
$67/Sq Ft
Est. Value
About This Home
This home is located at 1104 E 13th St, Texarkana, AR 71854 and is currently estimated at $92,667, approximately $66 per square foot. 1104 E 13th St is a home located in Miller County with nearby schools including Arkansas High School and Washington Academy.
Ownership History
Date
Name
Owned For
Owner Type
Purchase Details
Closed on
Dec 16, 2020
Sold by
Renfro Brandon and Renfro Callie
Bought by
Massey Roy S
Current Estimated Value
Home Financials for this Owner
Home Financials are based on the most recent Mortgage that was taken out on this home.
Original Mortgage
$41,250
Outstanding Balance
$36,555
Interest Rate
2.7%
Mortgage Type
New Conventional
Estimated Equity
$56,112
Purchase Details
Closed on
Oct 14, 2011
Sold by
Sanders Brandon Beck
Bought by
Renfro Brandon and Renfro Callie
Home Financials for this Owner
Home Financials are based on the most recent Mortgage that was taken out on this home.
Original Mortgage
$34,000
Interest Rate
4.13%
Mortgage Type
Purchase Money Mortgage
Purchase Details
Closed on
May 1, 1996
Bought by
Swanger Polly and Clift Suz-Anne
Purchase Details
Closed on
Aug 21, 1995
Bought by
Nielson Patty R
Purchase Details
Closed on
Jun 1, 1991
Bought by
Nielson Patty R
Create a Home Valuation Report for This Property
The Home Valuation Report is an in-depth analysis detailing your home's value as well as a comparison with similar homes in the area
Purchase History
| Date | Buyer | Sale Price | Title Company |
|---|---|---|---|
| Massey Roy S | $55,000 | Southwest Title Co | |
| Renfro Brandon | $40,000 | None Available | |
| Swanger Polly | $27,000 | -- | |
| Nielson Patty R | -- | -- | |
| Nielson Patty R | -- | -- |
Source: Public Records
Mortgage History
| Date | Status | Borrower | Loan Amount |
|---|---|---|---|
| Open | Massey Roy S | $41,250 | |
| Previous Owner | Renfro Brandon | $34,000 |
Source: Public Records
Tax History
| Year | Tax Paid | Tax Assessment Tax Assessment Total Assessment is a certain percentage of the fair market value that is determined by local assessors to be the total taxable value of land and additions on the property. | Land | Improvement |
|---|---|---|---|---|
| 2025 | $475 | $12,530 | $930 | $11,600 |
| 2024 | $432 | $7,530 | $930 | $6,600 |
| 2023 | $413 | $7,530 | $930 | $6,600 |
| 2022 | $413 | $7,530 | $930 | $6,600 |
| 2021 | $413 | $7,530 | $930 | $6,600 |
| 2020 | $413 | $8,790 | $2,030 | $6,760 |
| 2019 | $460 | $8,380 | $2,030 | $6,350 |
| 2018 | $460 | $8,380 | $2,030 | $6,350 |
| 2017 | $460 | $8,380 | $2,030 | $6,350 |
| 2016 | $460 | $8,380 | $2,030 | $6,350 |
| 2015 | $460 | $8,380 | $2,030 | $6,350 |
| 2014 | $478 | $8,710 | $2,030 | $6,680 |
Source: Public Records
Map
Nearby Homes
- 1222 Senator St
- 1218 Senator St
- 1217 Linden Ave
- 1223 Linden Ave
- 1216 Senator St
- 1300 Senator St
- 1209 Linden Ave
- 1115 E 13th St
- 1302 Senator St
- 1205 Linden Ave
- 1303 Linden Ave
- 1223 Senator St
- 1301 Senator St
- 1306 Senator St
- 1200 Senator St
- 1305 Linden Ave
- 1201 Linden Ave
- 1308 Senator St
- 1307 Senator St
- 1302 Linden Ave
Your Personal Tour Guide
Ask me questions while you tour the home.