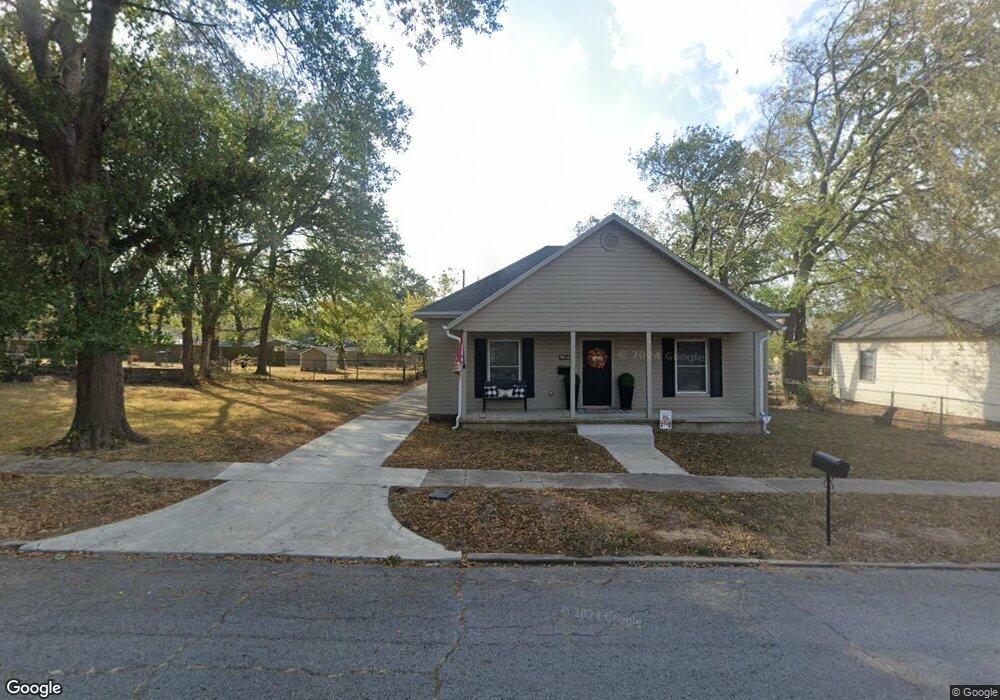
1104 E 9th St Okmulgee, OK 74447
Estimated Value: $74,644 - $116,000
2
Beds
1
Bath
1,062
Sq Ft
$91/Sq Ft
Est. Value
About This Home
This home is located at 1104 E 9th St, Okmulgee, OK 74447 and is currently estimated at $96,661, approximately $91 per square foot. 1104 E 9th St is a home located in Okmulgee County with nearby schools including Okmulgee Primary School, Dunbar Elementary School, and Okmulgee Middle School.
Ownership History
Date
Name
Owned For
Owner Type
Purchase Details
Closed on
Dec 14, 2020
Sold by
Weatherford Randy and Weatherford Julie
Bought by
Nelson Christie
Current Estimated Value
Purchase Details
Closed on
Feb 13, 2008
Sold by
Crawford Ann Elizabeth
Bought by
Weatherford Randy and Weatherford Rick
Create a Home Valuation Report for This Property
The Home Valuation Report is an in-depth analysis detailing your home's value as well as a comparison with similar homes in the area
Home Values in the Area
Average Home Value in this Area
Purchase History
| Date | Buyer | Sale Price | Title Company |
|---|---|---|---|
| Nelson Christie | $66,000 | None Available | |
| Weatherford Randy | $15,000 | None Available |
Source: Public Records
Tax History
| Year | Tax Paid | Tax Assessment Tax Assessment Total Assessment is a certain percentage of the fair market value that is determined by local assessors to be the total taxable value of land and additions on the property. | Land | Improvement |
|---|---|---|---|---|
| 2025 | $492 | $6,377 | $360 | $6,017 |
| 2024 | $470 | $6,192 | $360 | $5,832 |
| 2023 | $674 | $7,920 | $360 | $7,560 |
| 2022 | $670 | $7,920 | $360 | $7,560 |
| 2021 | $700 | $7,920 | $360 | $7,560 |
| 2020 | $264 | $2,980 | $360 | $2,620 |
| 2019 | $251 | $2,838 | $360 | $2,478 |
| 2018 | $242 | $2,704 | $360 | $2,344 |
| 2017 | $228 | $2,574 | $360 | $2,214 |
| 2016 | $218 | $2,452 | $360 | $2,092 |
| 2015 | $188 | $2,187 | $360 | $1,827 |
| 2014 | $181 | $2,083 | $360 | $1,723 |
Source: Public Records
Map
Nearby Homes
Your Personal Tour Guide
Ask me questions while you tour the home.