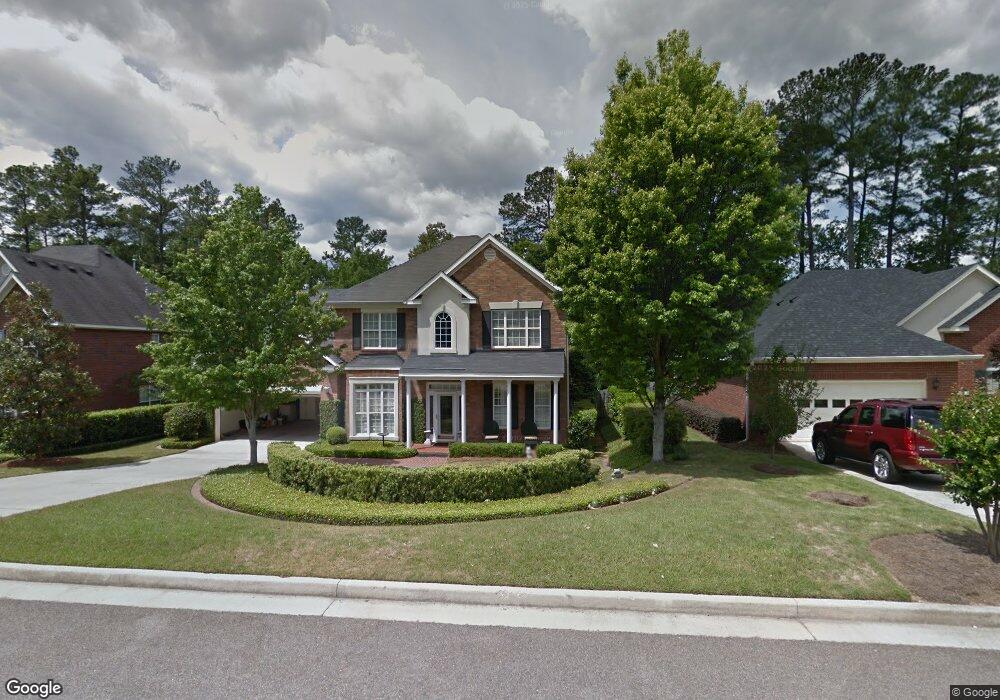
1104 Hampstead Place Augusta, GA 30907
Estimated Value: $404,000 - $447,000
4
Beds
3
Baths
2,917
Sq Ft
$143/Sq Ft
Est. Value
About This Home
This home is located at 1104 Hampstead Place, Augusta, GA 30907 and is currently estimated at $417,607, approximately $143 per square foot. 1104 Hampstead Place is a home located in Columbia County with nearby schools including Roosevelt Elementary School, Northmore Elementary School, and Stevens Creek Elementary School.
Ownership History
Date
Name
Owned For
Owner Type
Purchase Details
Closed on
Nov 18, 2020
Sold by
Barnard Betty B
Bought by
Williamson Charles W
Current Estimated Value
Home Financials for this Owner
Home Financials are based on the most recent Mortgage that was taken out on this home.
Original Mortgage
$136,000
Outstanding Balance
$120,322
Interest Rate
2.8%
Mortgage Type
New Conventional
Estimated Equity
$297,285
Purchase Details
Closed on
Jan 8, 2019
Sold by
Barnard Druie Douglas
Bought by
Barnard Betty B
Purchase Details
Closed on
Jun 14, 2001
Sold by
Bill Beazley Homes Inc
Bought by
Barnard D Douglas and Barnard Betty B
Home Financials for this Owner
Home Financials are based on the most recent Mortgage that was taken out on this home.
Original Mortgage
$165,000
Interest Rate
7.1%
Create a Home Valuation Report for This Property
The Home Valuation Report is an in-depth analysis detailing your home's value as well as a comparison with similar homes in the area
Home Values in the Area
Average Home Value in this Area
Purchase History
| Date | Buyer | Sale Price | Title Company |
|---|---|---|---|
| Williamson Charles W | $286,000 | -- | |
| Barnard Betty B | -- | -- | |
| Barnard D Douglas | $211,400 | -- |
Source: Public Records
Mortgage History
| Date | Status | Borrower | Loan Amount |
|---|---|---|---|
| Open | Williamson Charles W | $136,000 | |
| Previous Owner | Barnard D Douglas | $165,000 |
Source: Public Records
Tax History Compared to Growth
Tax History
| Year | Tax Paid | Tax Assessment Tax Assessment Total Assessment is a certain percentage of the fair market value that is determined by local assessors to be the total taxable value of land and additions on the property. | Land | Improvement |
|---|---|---|---|---|
| 2025 | $3,953 | $165,269 | $28,004 | $137,265 |
| 2024 | $3,593 | $143,451 | $26,504 | $116,947 |
| 2023 | $3,593 | $115,597 | $20,804 | $94,793 |
| 2022 | $3,139 | $120,528 | $22,004 | $98,524 |
| 2021 | $3,098 | $113,760 | $18,804 | $94,956 |
| 2020 | $976 | $98,798 | $18,504 | $80,294 |
| 2019 | $964 | $97,537 | $18,004 | $79,533 |
| 2018 | $1,006 | $100,969 | $17,504 | $83,465 |
| 2017 | $932 | $92,238 | $17,004 | $75,234 |
| 2016 | $852 | $93,679 | $16,580 | $77,099 |
| 2015 | $791 | $86,630 | $15,880 | $70,750 |
| 2014 | $796 | $85,165 | $16,680 | $68,485 |
Source: Public Records
Map
Nearby Homes
- 1094 Hampstead Place
- 1119 Hampstead Place
- 307 Old Salem Way
- 2032 Pheasant Creek Dr
- 3555 Watervale Way
- 705 Cool Brook Ct
- 333 Old Salem Way
- 816 Brookfield Pkwy
- 3503 Wakefield Ct
- 828 Mayo Ln
- 2020 Autumn Chase
- 2044 Bridgewater Dr
- 3038 Sterling Rd
- 3593 Westhampton Dr
- 3244 Riverstone Dr
- 414 Parliament Rd
- 408 Hastings Place
- 271 Watervale Rd
- 3597 Parliament Ln
- 820 Mitchell St
- 1102 Hampstead Place
- 1106 Hampstead Place
- 3557 Granite Way
- 1108 Hampstead Place
- 1100 Hampstead Place
- 1105 Hampstead Place
- 1103 Hampstead Place
- 3559 Granite Way
- 1109 Hampstead Place
- 1110 Hampstead Place
- 1098 Hampstead Place
- 1101 Hampstead Place
- 3561 Granite Way
- 1111 Hampstead Place
- 1112 Hampstead Place
- 1096 Hampstead Place
- 357 Heath Way
- 353 Heath Way
- 359 Heath Way
- 355 Heath Way