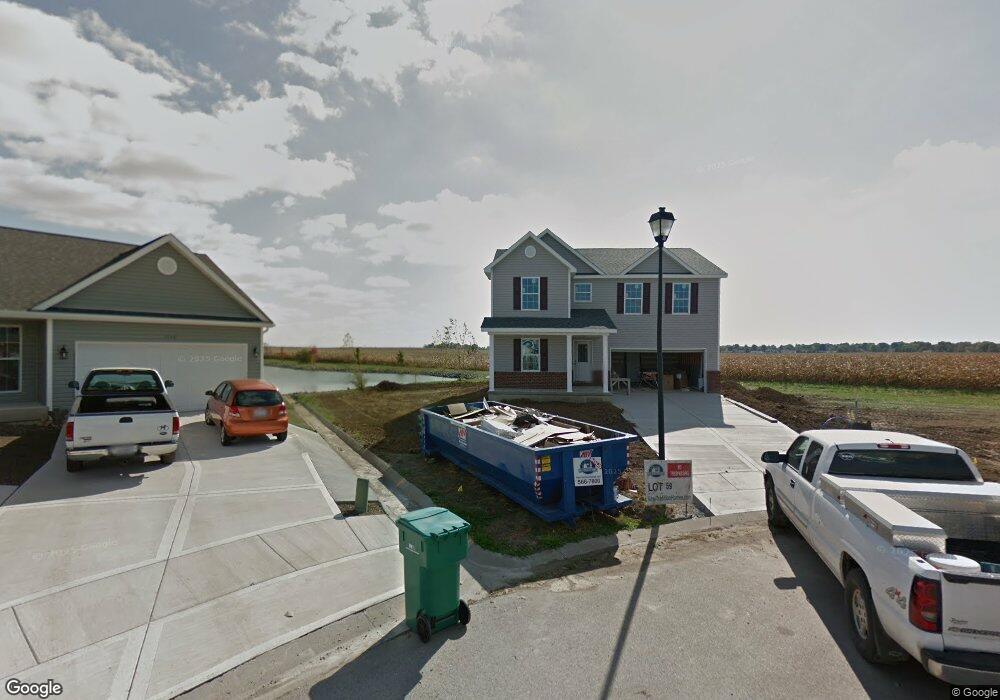
1104 Lear Ln Mascoutah, IL 62258
Estimated Value: $324,569 - $389,000
Studio
--
Bath
1,459
Sq Ft
$241/Sq Ft
Est. Value
About This Home
This home is located at 1104 Lear Ln, Mascoutah, IL 62258 and is currently estimated at $351,392, approximately $240 per square foot. 1104 Lear Ln is a home with nearby schools including Mascoutah High School and Holy Childhood of Jesus School.
Ownership History
Date
Name
Owned For
Owner Type
Purchase Details
Closed on
Nov 15, 2013
Sold by
New Tradition Homes Llc
Bought by
Hill Charissa and Hill John S
Current Estimated Value
Home Financials for this Owner
Home Financials are based on the most recent Mortgage that was taken out on this home.
Original Mortgage
$142,000
Outstanding Balance
$73,560
Interest Rate
4.5%
Mortgage Type
New Conventional
Estimated Equity
$277,832
Purchase Details
Closed on
Apr 26, 2013
Sold by
Straqr Properties Llc
Bought by
New Tradition Homes Llc
Purchase Details
Closed on
Feb 26, 2010
Sold by
Stifel Bank
Bought by
Straqr Properties Llc
Home Financials for this Owner
Home Financials are based on the most recent Mortgage that was taken out on this home.
Original Mortgage
$515,000
Interest Rate
3.25%
Mortgage Type
Future Advance Clause Open End Mortgage
Purchase Details
Closed on
Sep 2, 2008
Sold by
Concord Bank
Bought by
Stifel Bank & Trust and Southern Commercial Bank
Create a Home Valuation Report for This Property
The Home Valuation Report is an in-depth analysis detailing your home's value as well as a comparison with similar homes in the area
Purchase History
| Date | Buyer | Sale Price | Title Company |
|---|---|---|---|
| Hill Charissa | $212,500 | Fatic | |
| New Tradition Homes Llc | $135,000 | Fatic | |
| Straqr Properties Llc | $1,030,000 | None Available | |
| Stifel Bank & Trust | -- | Benchmark Title Company Llc | |
| Concord Bank | -- | Benchmark Title Company Llc |
Source: Public Records
Mortgage History
| Date | Status | Borrower | Loan Amount |
|---|---|---|---|
| Open | Hill Charissa | $142,000 | |
| Previous Owner | Straqr Properties Llc | $515,000 |
Source: Public Records
Tax History
| Year | Tax Paid | Tax Assessment Tax Assessment Total Assessment is a certain percentage of the fair market value that is determined by local assessors to be the total taxable value of land and additions on the property. | Land | Improvement |
|---|---|---|---|---|
| 2024 | $6,700 | $96,173 | $7,931 | $88,242 |
| 2023 | $6,358 | $87,893 | $7,248 | $80,645 |
| 2022 | $6,262 | $79,990 | $6,596 | $73,394 |
| 2021 | $6,273 | $78,866 | $6,388 | $72,478 |
| 2020 | $5,994 | $73,977 | $5,992 | $67,985 |
| 2019 | $5,847 | $73,977 | $5,992 | $67,985 |
| 2018 | $5,715 | $71,990 | $5,831 | $66,159 |
| 2017 | $5,775 | $69,610 | $6,237 | $63,373 |
| 2016 | $5,709 | $68,608 | $6,147 | $62,461 |
| 2014 | $5,043 | $67,039 | $6,006 | $61,033 |
| 2013 | $387 | $15,000 | $5,921 | $9,079 |
Source: Public Records
Map
Nearby Homes
- 9719 Iroquois Dr
- 1151 Illiniwek Dr
- 1113 Menominee Trail
- 9723 Weatherby St
- 924 Dere Bere Dr
- 652 Moorland Cir
- 847 Topaz Ct
- 7 Hunters Trail
- 9640 Mallard Dr
- 717 Knipp Dr
- 91 W Harnett St
- 1192 Widgeon Dr
- 25 W Oak St
- 27 Coachlight Dr
- 3 W Patterson St
- 306 W Patterson St
- 30 W Patterson St
- 926 W Green St
- 1017 W Green St
- 108 E Main St
Your Personal Tour Guide
Ask me questions while you tour the home.