1104 Lord St Waycross, GA 31501
Estimated Value: $127,000 - $276,000
6
Beds
4
Baths
3,264
Sq Ft
$67/Sq Ft
Est. Value
About This Home
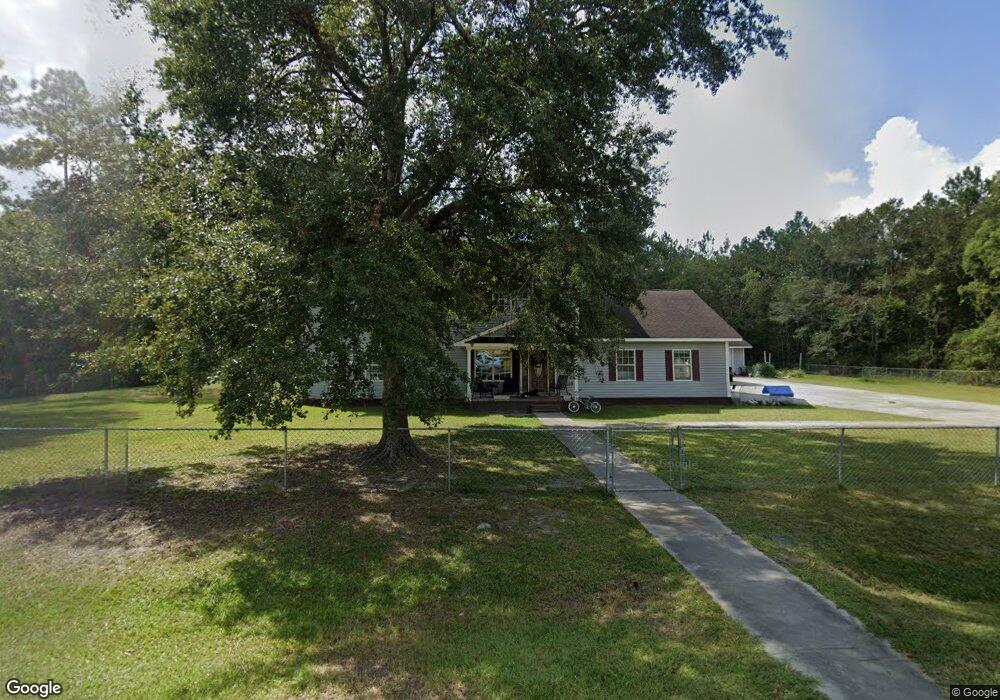
This home is located at 1104 Lord St, Waycross, GA 31501 and is currently estimated at $219,362, approximately $67 per square foot. 1104 Lord St is a home located in Ware County with nearby schools including Memorial Drive Elementary School, Waycross Middle School, and Ware County High School.
Ownership History
Date
Name
Owned For
Owner Type
Purchase Details
Closed on
Feb 27, 2006
Sold by
Lasalle Bank National Asso
Bought by
Allen James
Current Estimated Value
Home Financials for this Owner
Home Financials are based on the most recent Mortgage that was taken out on this home.
Original Mortgage
$132,000
Outstanding Balance
$74,071
Interest Rate
6.05%
Mortgage Type
New Conventional
Estimated Equity
$145,291
Purchase Details
Closed on
May 3, 2005
Sold by
Taylor Andrea
Bought by
Lasalle Bank National Associat
Purchase Details
Closed on
Mar 13, 2002
Sold by
Nadroj Associates In
Bought by
Taylor Norris
Purchase Details
Closed on
Sep 15, 2000
Sold by
Nadroj Associates In
Bought by
Kelrich Properties Inc
Purchase Details
Closed on
Mar 9, 1999
Sold by
Whitley Robert
Bought by
Nadroj Associates In
Purchase Details
Closed on
Nov 27, 1996
Sold by
Melton Dorothy S
Bought by
Nadroj Associates In
Purchase Details
Closed on
Jun 3, 1993
Bought by
Melton Dorothy S
Create a Home Valuation Report for This Property
The Home Valuation Report is an in-depth analysis detailing your home's value as well as a comparison with similar homes in the area
Home Values in the Area
Average Home Value in this Area
Purchase History
| Date | Buyer | Sale Price | Title Company |
|---|---|---|---|
| Allen James | $132,000 | -- | |
| Lasalle Bank National Associat | $114,750 | -- | |
| Taylor Norris | $25,000 | -- | |
| Kelrich Properties Inc | $7,800 | -- | |
| Nadroj Associates In | -- | -- | |
| Nadroj Associates In | -- | -- | |
| Melton Dorothy S | -- | -- |
Source: Public Records
Mortgage History
| Date | Status | Borrower | Loan Amount |
|---|---|---|---|
| Open | Allen James | $132,000 |
Source: Public Records
Tax History Compared to Growth
Tax History
| Year | Tax Paid | Tax Assessment Tax Assessment Total Assessment is a certain percentage of the fair market value that is determined by local assessors to be the total taxable value of land and additions on the property. | Land | Improvement |
|---|---|---|---|---|
| 2024 | $2,581 | $104,277 | $7,140 | $97,137 |
| 2023 | $2,635 | $83,058 | $4,015 | $79,043 |
| 2022 | $2,930 | $83,058 | $4,015 | $79,043 |
| 2021 | $3,064 | $78,359 | $4,015 | $74,344 |
| 2020 | $3,041 | $75,260 | $4,015 | $71,245 |
| 2019 | $3,037 | $72,161 | $4,015 | $68,146 |
| 2018 | $3,017 | $69,062 | $4,015 | $65,047 |
| 2017 | $2,946 | $69,062 | $4,015 | $65,047 |
| 2016 | $2,946 | $69,062 | $4,015 | $65,047 |
| 2015 | $2,967 | $69,062 | $4,015 | $65,047 |
| 2014 | $2,528 | $59,146 | $4,015 | $55,131 |
| 2013 | -- | $69,062 | $4,014 | $65,047 |
Source: Public Records
Map
Nearby Homes
- 1105 Assembly St
- 1401 Congress St
- 1403 Congress St
- 1312 Congress St
- 1110 Assembly St
- 1302 Congress St
- 1409 Congress St
- 1106 Senate St
- 1020 Burgess St
- 1020 Assembly St
- 1104 Senate St
- 1501 House St
- 1210 Congress St
- 1111 Congress St
- 1203 Assembly St
- 1102 Senate St
- 910 Burgess St
- 1315 Senate St
- 1101 Senate St
- 1001 Burgess St