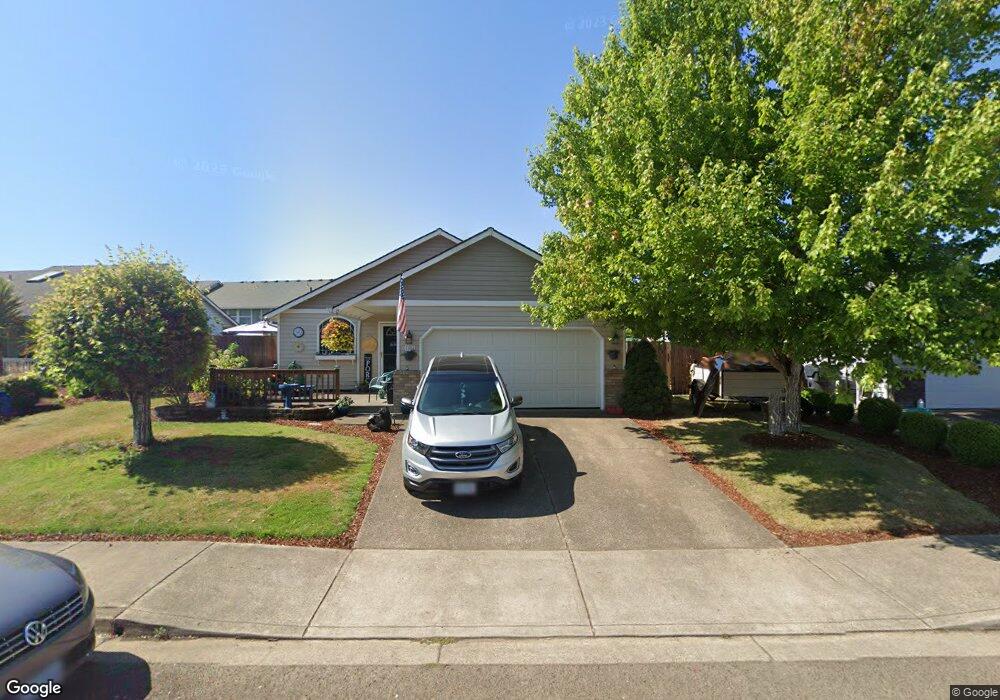
1104 Mountain View Ln Molalla, OR 97038
Estimated Value: $429,860 - $462,000
3
Beds
2
Baths
1,341
Sq Ft
$335/Sq Ft
Est. Value
About This Home
This home is located at 1104 Mountain View Ln, Molalla, OR 97038 and is currently estimated at $449,465, approximately $335 per square foot. 1104 Mountain View Ln is a home located in Clackamas County with nearby schools including Oregon Outreach - Molalla Pride.
Ownership History
Date
Name
Owned For
Owner Type
Purchase Details
Closed on
Jul 12, 2017
Sold by
Heilman Lee F and Heilman Christine K
Bought by
Heilman Lee F and Heilman Christine K
Current Estimated Value
Purchase Details
Closed on
Dec 20, 2012
Sold by
Quinlan Cameron D and Quinlan Iva M
Bought by
Heilman Brandon J
Home Financials for this Owner
Home Financials are based on the most recent Mortgage that was taken out on this home.
Original Mortgage
$182,551
Outstanding Balance
$126,027
Interest Rate
3.37%
Mortgage Type
New Conventional
Estimated Equity
$323,438
Purchase Details
Closed on
Jul 1, 2003
Sold by
Hutson Thomas W
Bought by
Quinlan Cameron D and Quinlan Iva M
Home Financials for this Owner
Home Financials are based on the most recent Mortgage that was taken out on this home.
Original Mortgage
$142,759
Interest Rate
5.26%
Mortgage Type
FHA
Purchase Details
Closed on
May 8, 2002
Sold by
The Doveton Corp
Bought by
Hutson Thomas W
Create a Home Valuation Report for This Property
The Home Valuation Report is an in-depth analysis detailing your home's value as well as a comparison with similar homes in the area
Purchase History
We collect this data history from publicly available records. To have your information removed, we recommend requesting removal directly through your county’s website.
| Date | Buyer | Sale Price | Title Company |
|---|---|---|---|
| Heilman Lee F | -- | None Available | |
| Heilman Lee F | -- | None Available | |
| Heilman Brandon J | $178,900 | Fidelity National Title Comp | |
| Quinlan Cameron D | $145,000 | Ticor Title Insurance Compan | |
| Hutson Thomas W | $45,000 | First American |
Source: Public Records
Mortgage History
We collect this data history from publicly available records. To have your information removed, we recommend requesting removal directly through your county’s website.
| Date | Status | Borrower | Loan Amount |
|---|---|---|---|
| Open | Heilman Brandon J | $182,551 | |
| Previous Owner | Quinlan Cameron D | $142,759 |
Source: Public Records
Tax History
| Year | Tax Paid | Tax Assessment Tax Assessment Total Assessment is a certain percentage of the fair market value that is determined by local assessors to be the total taxable value of land and additions on the property. | Land | Improvement |
|---|---|---|---|---|
| 2025 | $4,068 | $212,361 | -- | -- |
| 2024 | $3,932 | $206,176 | -- | -- |
| 2023 | $3,932 | $200,171 | $0 | $0 |
| 2022 | $3,242 | $194,341 | $0 | $0 |
| 2021 | $3,109 | $188,681 | $0 | $0 |
| 2020 | $3,022 | $183,186 | $0 | $0 |
| 2019 | $2,935 | $177,851 | $0 | $0 |
| 2018 | $2,853 | $172,671 | $0 | $0 |
| 2017 | $2,735 | $167,642 | $0 | $0 |
| 2016 | $2,593 | $162,759 | $0 | $0 |
| 2015 | $2,519 | $158,018 | $0 | $0 |
| 2014 | $2,441 | $153,416 | $0 | $0 |
Source: Public Records
Map
Nearby Homes
- 880 Meadowlark Place
- 1424 Mount View Ln
- 845 Meadow Dr
- 829 Toliver Rd
- 736 Kelsey Loop
- 718 Trinity Ct
- 850 Columbia Dr
- 340 Doug Fir Ln
- 619 Wedgewood Dr
- 900 Bear Creek Dr
- 1017 S View Dr
- 898 James Dr
- 695 Mary Dr
- 671 Mary Dr
- 1260 Rachel Ln
- 1200 Rachel Ln
- 1160 Rachel Ln
- 1201 Rachel Ln
- 1191 Rachel Ln
- 1161 Rachel Ln
- 1104 Mountain View Ln Unit 1
- 1110 Mountain View Ln
- 1110 Mount View Ln Unit 1
- 1062 Mt View Ln
- 1062 Mountain View Ln Unit 1
- 1062 Mountain View Ln
- 1056 Mt View Ln
- 1056 Mountain View Ln
- 1085 Cascade Ln
- 1075 Cascade Ln
- 1105 Mountain View Ln
- 1105 Mt View Ln
- 1063 Mountain View Ln
- 1063 Mt View Ln
- 1109 Mountain View Ln
- 1065 Cascade Ln
- 1057 Mountain View Ln
- 1057 Mount View Ln
- 1044 Mt View Ln
- 1111 Mountain View Ln
Your Personal Tour Guide
Ask me questions while you tour the home.