NOT LISTED FOR SALE

Estimated Value: $73,000 - $121,374

2 Beds
1 Bath
1,073 Sq Ft
$93/Sq Ft Est. Value

Last Sold March 14, 2019

Last sale price $39,000 $36 Per Sq Ft

Est. 155% increase in value since last sale

Current estimated payment $601/month

About This Home

As of March 2019

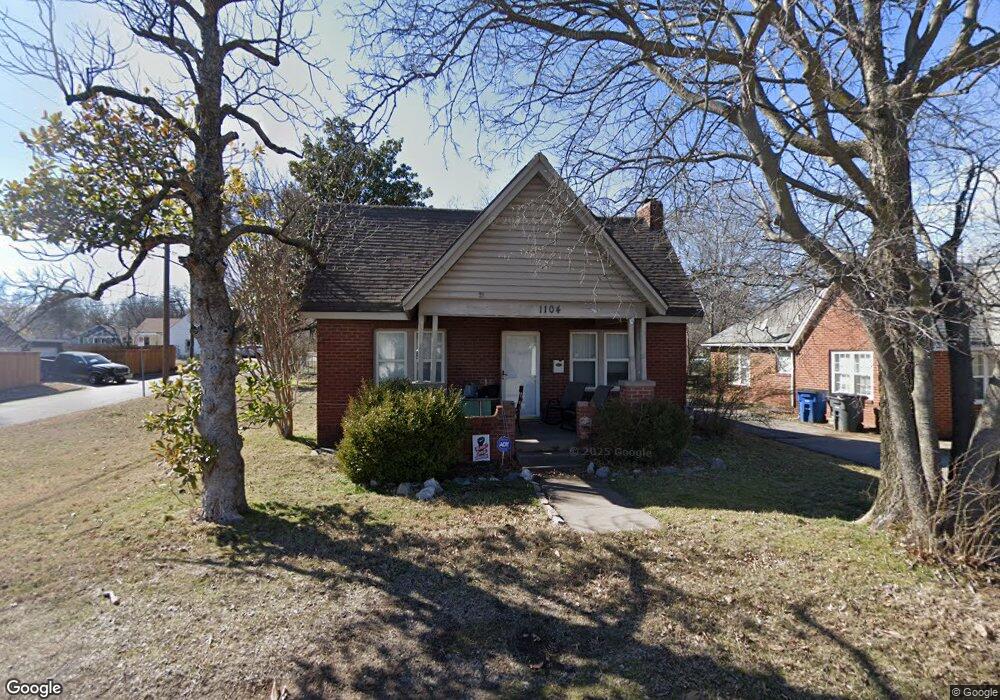
This home is located at 1104 N Gary Place, Tulsa, OK 74110 and is currently estimated at $99,594, approximately $92 per square foot. 1104 N Gary Place is a home located in Tulsa County with nearby schools including Sequoyah Elementary School, Monroe Demonstration Academy, and McLain High School of Science and Technology.

Ownership History

Date Name Owned For Owner Type

Purchase Details

Closed on
Aug 15, 2018
Sold by
Oleson Beth Ann
Bought by
Lsf9 Master Participation Trust
Current Estimated Value
$99,594

Purchase Details

Closed on
May 8, 2006
Sold by
Brookshire John M and Brookshire Shannon
Bought by
Oleson Beth Ann

Home Financials for this Owner

Home Financials are based on the most recent Mortgage that was taken out on this home.
Original Mortgage
$62,500
Interest Rate
6.5%
Mortgage Type
Fannie Mae Freddie Mac

Purchase Details

Closed on
Dec 2, 2000
Sold by
Lovett Joseph L and Lovett Loretta R
Bought by
Bulick Brenda R
Source: Public Records

Range of Values:

Collateral Analytics

Collateral Analytics Collateral Analytics AVMs (Automated Valuation Model) employ a number of statistical approaches combined with neighborhood-specific comparable selection guarantees the most up-to-date and precise valuations.

Not Available

Collateral Analytics does not have data for the current month. Please view the chart for historical values.

ICE

ICE Mortgage Technology ICE Mortgage Technology’s AVM (Automated Valuation Model) is a state-of-the-art online residential property valuation tool that provides a quick and accurate estimate of the value of almost any home in the U.S.

Not Available

ICE Mortgage Technology does not have data for the current month. Please view the chart for historical values.

First American

First American First American Data & Analytics’ next-generation AVM combines unrivaled data assets with a blended ensemble of valuation models to produce highly accurate, reliable valuations you can trust.

Not Available

First American does not have data for the current month. Please view the chart for historical values.

Quantarium

Quantarium Quantarium’s valuation service, repeatedly proven the industry’s most accurate and comprehensive, is supercharged with a self-learning and auto-tuning AI engine that continually becomes smarter and more accurate as it processes daily inputs from the industry’s leading RE data lake.

Not Available

Quantarium does not have data for the current month. Please view the chart for historical values.

Average Value
Not Available
List Price
Sold Price
Create a Home Valuation Report for This Property
The Home Valuation Report is an in-depth analysis detailing your home's value as well as a comparison with similar homes in the area

Home Values in the Area

Source: Public Records

Average Home Value in this Area


Source: Public Records

Purchase History

Date Buyer Sale Price Title Company
Lsf9 Master Participation Trust -- None Available
Oleson Beth Ann $62,500 None Available
Bulick Brenda R -- --
Source: Public Records

Mortgage History

Date Status Borrower Loan Amount
Previous Owner Oleson Beth Ann $62,500
Source: Public Records

Property History

Date Event Price List to Sale Price per Sq Ft Prior Sale
03/14/2019 03/14/19 Sold $39,000 -7.1% $36 / Sq Ft View Prior Sale
02/13/2019 02/13/19 Pending -- -- --
02/13/2019 02/13/19 For Sale $42,000 -- $39 / Sq Ft

Tax History Compared to Growth

Source: Public Records

Tax History

Year Tax Paid Tax Assessment Tax Assessment Total Assessment is a certain percentage of the fair market value that is determined by local assessors to be the total taxable value of land and additions on the property. Land Improvement
2024 $865 $7,155 $791 $6,364
2023 $865 $6,815 $904 $5,911
2022 $865 $6,490 $990 $5,500
2021 $857 $6,490 $990 $5,500
2020 $845 $6,490 $990 $5,500
2019 $942 $6,875 $990 $5,885
2018 $807 $5,875 $846 $5,029
2017 $805 $6,875 $990 $5,885
2016 $789 $6,875 $990 $5,885
2015 $790 $6,875 $990 $5,885
2014 $783 $6,875 $990 $5,885
Source: Public Records

Agents Affiliated with this Home

  • Section Image
See All Agents

Map