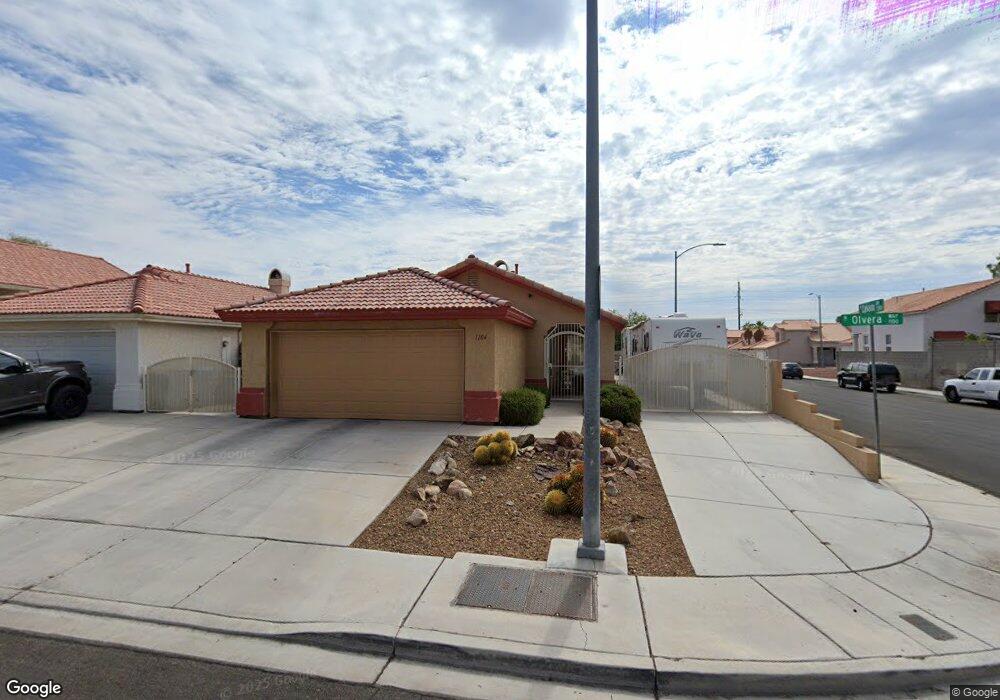
1104 Olvera Way Las Vegas, NV 89128
Pioneer Park NeighborhoodEstimated Value: $364,958 - $383,000
3
Beds
2
Baths
1,143
Sq Ft
$326/Sq Ft
Est. Value
About This Home
This home is located at 1104 Olvera Way, Las Vegas, NV 89128 and is currently estimated at $372,490, approximately $325 per square foot. 1104 Olvera Way is a home located in Clark County with nearby schools including Edythe & Lloyd Katz Elementary School, James B. McMillan Elementary School, and Ernest Becker Middle School.
Ownership History
Date
Name
Owned For
Owner Type
Purchase Details
Closed on
Aug 17, 2001
Sold by
Davis William R and Davis Julie A
Bought by
Williams David L
Current Estimated Value
Home Financials for this Owner
Home Financials are based on the most recent Mortgage that was taken out on this home.
Original Mortgage
$124,900
Outstanding Balance
$46,694
Interest Rate
7.21%
Estimated Equity
$325,796
Purchase Details
Closed on
Oct 13, 1999
Sold by
Lyons Jimmie L and Lyons Melinda
Bought by
Davis William R and Carlson Julie Z
Home Financials for this Owner
Home Financials are based on the most recent Mortgage that was taken out on this home.
Original Mortgage
$111,810
Interest Rate
7.86%
Mortgage Type
FHA
Purchase Details
Closed on
Nov 17, 1997
Sold by
Lyons Melinda and Zimmerman Melinda
Bought by
Lyons Jimmie L and Lyons Melinda
Create a Home Valuation Report for This Property
The Home Valuation Report is an in-depth analysis detailing your home's value as well as a comparison with similar homes in the area
Home Values in the Area
Average Home Value in this Area
Purchase History
| Date | Buyer | Sale Price | Title Company |
|---|---|---|---|
| Williams David L | $131,500 | Lawyers Title Insurance Corp | |
| Davis William R | $112,000 | National Title Company | |
| Lyons Jimmie L | -- | United Title |
Source: Public Records
Mortgage History
| Date | Status | Borrower | Loan Amount |
|---|---|---|---|
| Open | Williams David L | $124,900 | |
| Previous Owner | Davis William R | $111,810 |
Source: Public Records
Tax History
| Year | Tax Paid | Tax Assessment Tax Assessment Total Assessment is a certain percentage of the fair market value that is determined by local assessors to be the total taxable value of land and additions on the property. | Land | Improvement |
|---|---|---|---|---|
| 2026 | $1,423 | $74,680 | $33,600 | $41,080 |
| 2025 | $1,381 | $75,594 | $33,600 | $41,994 |
| 2024 | $1,341 | $75,594 | $33,600 | $41,994 |
| 2023 | $1,341 | $70,935 | $30,800 | $40,135 |
| 2022 | $1,302 | $63,085 | $26,250 | $36,835 |
| 2021 | $1,264 | $59,742 | $24,500 | $35,242 |
| 2020 | $1,225 | $58,531 | $23,450 | $35,081 |
| 2019 | $1,189 | $54,614 | $19,950 | $34,664 |
| 2018 | $1,154 | $48,975 | $15,400 | $33,575 |
| 2017 | $1,624 | $49,547 | $15,400 | $34,147 |
| 2016 | $1,094 | $46,650 | $12,250 | $34,400 |
| 2015 | $1,091 | $38,367 | $7,700 | $30,667 |
| 2014 | $1,059 | $31,343 | $7,700 | $23,643 |
Source: Public Records
Map
Nearby Homes
- 1005 Rainbow Meadows Dr
- 7308 Calvado St
- 7428 Sunspot Dr
- 1301 Rainbow Meadows Dr
- 1108 Pagosa Way
- 1009 Pagosa Way
- 7329 Restful Springs Ct
- 7320 Silver Ridge Dr
- 1312 Wheatland Way
- 1317 Pacific Terrace Dr
- 7104 Carmen Blvd
- 1428 Pacific Terrace Dr
- 1150 N Buffalo Dr Unit 1075
- 1150 N Buffalo Dr Unit 2029
- 1016 Willow Tree Dr Unit B
- 1028 Willow Tree Dr Unit D
- 1201 N Buffalo Dr Unit 202
- 1112 Observation Dr Unit 201
- 7224 Single Pine Dr
- 7200 Pirates Cove Rd Unit 1021
- 1108 Olvera Way
- 1108 Olvera Way Unit home
- 1112 Olvera Way
- 1101 Rainbow Meadows Dr
- 1020 Olvera Way
- 1105 Rainbow Meadows Dr
- 1109 Rainbow Meadows Dr
- 1116 Olvera Way
- 1017 Rainbow Meadows Dr Unit n/a
- 1016 Olvera Way
- 1101 Olvera Way
- 1113 Rainbow Meadows Dr
- 1109 Olvera Way
- 1021 Olvera Way
- 1013 Rainbow Meadows Dr
- 1120 Olvera Way
- 1012 Olvera Way
- 1113 Olvera Way
- 1017 Olvera Way
- 1117 N Rainbow Meadows Dr
Your Personal Tour Guide
Ask me questions while you tour the home.