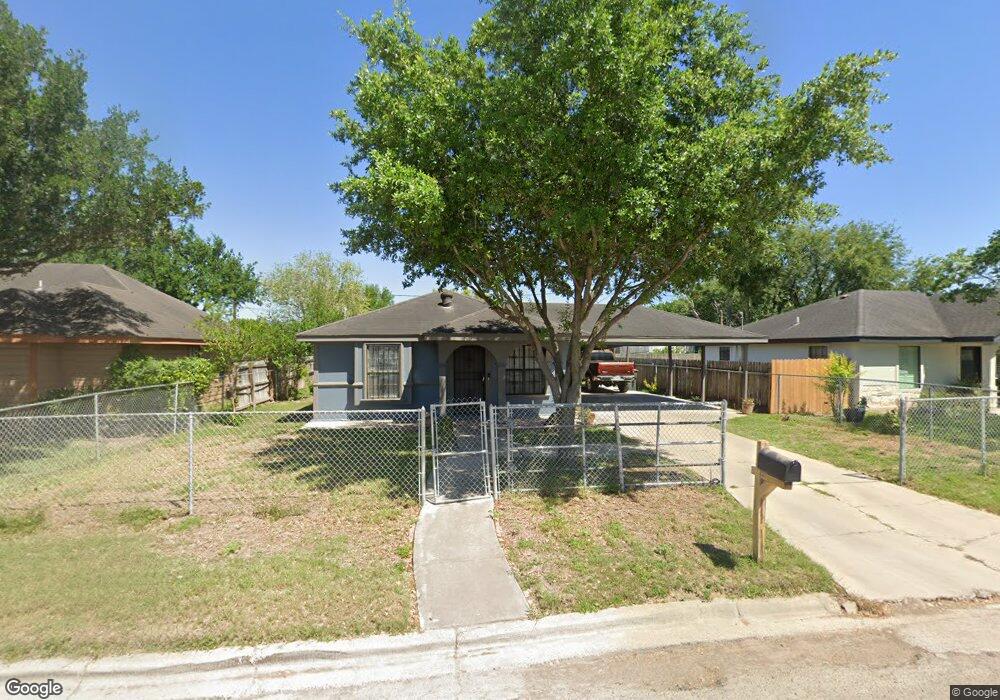
1104 Paloma Dr San Juan, TX 78589
Estimated Value: $113,000 - $159,000
2
Beds
1
Bath
957
Sq Ft
$138/Sq Ft
Est. Value
About This Home
This home is located at 1104 Paloma Dr, San Juan, TX 78589 and is currently estimated at $132,406, approximately $138 per square foot. 1104 Paloma Dr is a home located in Hidalgo County with nearby schools including Amanda Garza-Pena Elementary, Raul H. Yzaguirre Middle School, and PSJA Early College High School.
Ownership History
Date
Name
Owned For
Owner Type
Purchase Details
Closed on
Jul 1, 2015
Sold by
Cardinal Lots Ltd
Bought by
Orocio Jose Guadalupe and Mendoza Cynthia
Current Estimated Value
Home Financials for this Owner
Home Financials are based on the most recent Mortgage that was taken out on this home.
Original Mortgage
$31,700
Outstanding Balance
$24,761
Interest Rate
3.91%
Mortgage Type
Purchase Money Mortgage
Estimated Equity
$107,645
Purchase Details
Closed on
Feb 21, 2012
Sold by
Fletcher Group Joint Venture #2
Bought by
Mendoza Cynthia
Home Financials for this Owner
Home Financials are based on the most recent Mortgage that was taken out on this home.
Original Mortgage
$17,500
Interest Rate
3.95%
Mortgage Type
Seller Take Back
Purchase Details
Closed on
Feb 23, 2009
Sold by
Villanueva Emigdio
Bought by
Cardona Mendoza Cynthia and Cardona Medina Luis Alberto
Create a Home Valuation Report for This Property
The Home Valuation Report is an in-depth analysis detailing your home's value as well as a comparison with similar homes in the area
Home Values in the Area
Average Home Value in this Area
Purchase History
| Date | Buyer | Sale Price | Title Company |
|---|---|---|---|
| Orocio Jose Guadalupe | -- | None Available | |
| Mendoza Cynthia | -- | None Available | |
| Cardona Mendoza Cynthia | -- | None Available |
Source: Public Records
Mortgage History
| Date | Status | Borrower | Loan Amount |
|---|---|---|---|
| Open | Orocio Jose Guadalupe | $31,700 | |
| Previous Owner | Mendoza Cynthia | $17,500 |
Source: Public Records
Tax History Compared to Growth
Tax History
| Year | Tax Paid | Tax Assessment Tax Assessment Total Assessment is a certain percentage of the fair market value that is determined by local assessors to be the total taxable value of land and additions on the property. | Land | Improvement |
|---|---|---|---|---|
| 2025 | $2,406 | $119,594 | $46,404 | $73,190 |
| 2024 | $2,406 | $92,876 | $46,404 | $46,472 |
| 2023 | $2,412 | $93,162 | $39,914 | $53,248 |
| 2022 | $2,116 | $76,566 | $29,854 | $46,712 |
| 2021 | $1,770 | $62,639 | $27,258 | $35,381 |
| 2020 | $1,472 | $51,225 | $23,364 | $27,861 |
| 2019 | $1,497 | $50,220 | $23,364 | $26,856 |
| 2018 | $1,312 | $43,769 | $16,225 | $27,544 |
| 2017 | $1,342 | $44,459 | $16,225 | $28,234 |
| 2016 | $1,183 | $39,191 | $13,629 | $25,562 |
| 2015 | $1,287 | $39,797 | $13,629 | $26,168 |
Source: Public Records
Map
Nearby Homes
- 1100 Washingtonia Palm Ave
- 904 El Campo Dr
- 1003 Short Rd
- 311 E Salazar St
- 1318 Coconut Palm Ave
- 814 Gomez St
- 1322 Washingtonia Palm Ave
- 1107 San Ramon St
- 1103 San Cristobal St
- 904 Gonzalez Dr
- 406 Guadalupe Dr
- 913 Brecha Dr
- 309 E Salazar St
- 312 E Pino St
- 1313 E Evergreen St E
- 310 E Pino St
- 305 E Salazar St
- 308 E Pino St
- 700 E Fm 495
- 306 E Pino St
- 1106 Paloma Dr
- 1102 Paloma Dr
- 1108 Paloma Dr
- 1100 Paloma Dr
- 1109 Washingtonia Palm Ave
- 1111 Washingtonia Palm Ave
- 1107 Washingtonia Palm Ave
- 1103 Paloma Dr
- 1105 Paloma Dr
- 1105 Washingtonia Palm Ave
- 1101 Paloma Dr
- 1010 Paloma Dr
- 1110 Paloma Dr
- 1115 Washingtonia Palm Ave
- 1107 Paloma Dr
- 1011 Paloma Dr
- 1103 Washingtonia Palm Ave
- 1109 Paloma Dr
- 1112 Paloma Dr
- 1008 Paloma Dr