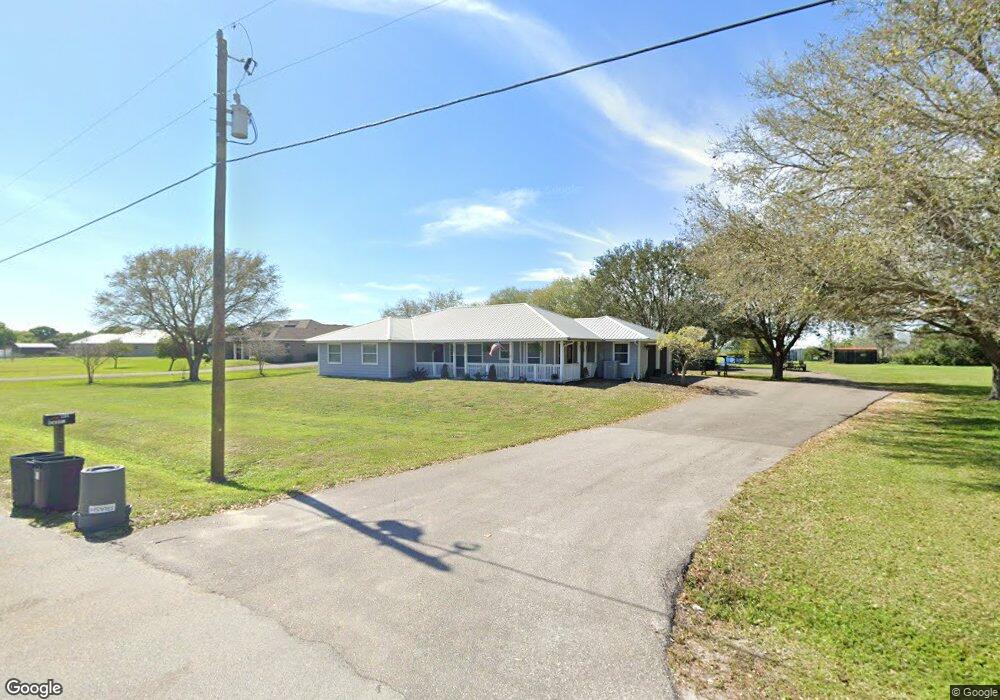
1104 Rodeo Rd Moore Haven, FL 33471
Estimated Value: $342,165 - $494,000
3
Beds
2
Baths
2,886
Sq Ft
$138/Sq Ft
Est. Value
About This Home
This home is located at 1104 Rodeo Rd, Moore Haven, FL 33471 and is currently estimated at $398,791, approximately $138 per square foot. 1104 Rodeo Rd is a home with nearby schools including Moore Haven Junior/Senior High School and Moore Haven Elementary School.
Ownership History
Date
Name
Owned For
Owner Type
Purchase Details
Closed on
Feb 13, 2025
Sold by
Cockram Daniel and Cockram Tabitha
Bought by
Nulty Nicholas Grover and Nulty Jacqueline
Current Estimated Value
Home Financials for this Owner
Home Financials are based on the most recent Mortgage that was taken out on this home.
Original Mortgage
$390,000
Outstanding Balance
$385,969
Interest Rate
6.91%
Mortgage Type
VA
Estimated Equity
$12,822
Purchase Details
Closed on
Jul 13, 2020
Sold by
Smith John H and Smith Elaine
Bought by
Cockram Daniel
Home Financials for this Owner
Home Financials are based on the most recent Mortgage that was taken out on this home.
Original Mortgage
$166,920
Interest Rate
3%
Mortgage Type
FHA
Purchase Details
Closed on
Sep 4, 2007
Sold by
Smith John H and Smith Elaine M
Bought by
Brown Janice D
Purchase Details
Closed on
Jan 25, 2003
Bought by
Smith John H
Create a Home Valuation Report for This Property
The Home Valuation Report is an in-depth analysis detailing your home's value as well as a comparison with similar homes in the area
Purchase History
| Date | Buyer | Sale Price | Title Company |
|---|---|---|---|
| Nulty Nicholas Grover | $390,000 | Landsel Title Agency | |
| Cockram Daniel | $170,000 | None Listed On Document | |
| Brown Janice D | $25,000 | None Available | |
| Smith John H | $25,000 | -- |
Source: Public Records
Mortgage History
| Date | Status | Borrower | Loan Amount |
|---|---|---|---|
| Open | Nulty Nicholas Grover | $390,000 | |
| Previous Owner | Cockram Daniel | $166,920 |
Source: Public Records
Tax History
| Year | Tax Paid | Tax Assessment Tax Assessment Total Assessment is a certain percentage of the fair market value that is determined by local assessors to be the total taxable value of land and additions on the property. | Land | Improvement |
|---|---|---|---|---|
| 2025 | $2,738 | $198,019 | -- | -- |
| 2024 | $2,557 | $192,438 | -- | -- |
| 2023 | $2,557 | $186,833 | $0 | $0 |
| 2022 | $2,468 | $181,391 | $0 | $0 |
| 2021 | $2,462 | $176,108 | $0 | $0 |
Source: Public Records
Map
Nearby Homes
- 0 Rodeo Rd
- 1099 Pine Ave
- 1086 Pine Ave
- 1040 Branch's Cir
- 1044 Branch's Cir
- Lot 16 Foxmoor St
- 1170 Foxmoor St
- TBD Elderberry Ave NW
- 209 Elderberry Ave NW
- 411 Elderberry Ave
- 1085 West Ave
- 214 Orchard Ave
- 409 Oakmont Ave
- 309 Pinecrest Ave NW
- 771 Avenue East NW
- 699 Avenue R
- 464 Avenue R
- 599 N Us Highway 27
- 599 Avenue R SW
- 571 Avenue D
- 900 Rodeo Rd
- 1090 Rodeo Rd
- 1142 Rodeo Rd
- 1163 Rodeo Rd
- 1173 Rodeo Rd
- 1915 U S Hwy N
- 1083 Western Dr
- 1139 Western Dr
- 1200 Rodeo Rd
- 2040 Us Highway 27
- 1254 Rodeo Rd
- 1630 N Us Highway 27
- 1233 Western Dr
- 1314 Rodeo Rd
- 1293 Rodeo Rd
- 1277 Western Dr
- 1315 Western Dr
- 1337 Western Dr
- 1375 Rodeo Rd
- 1365 Western Dr
Your Personal Tour Guide
Ask me questions while you tour the home.