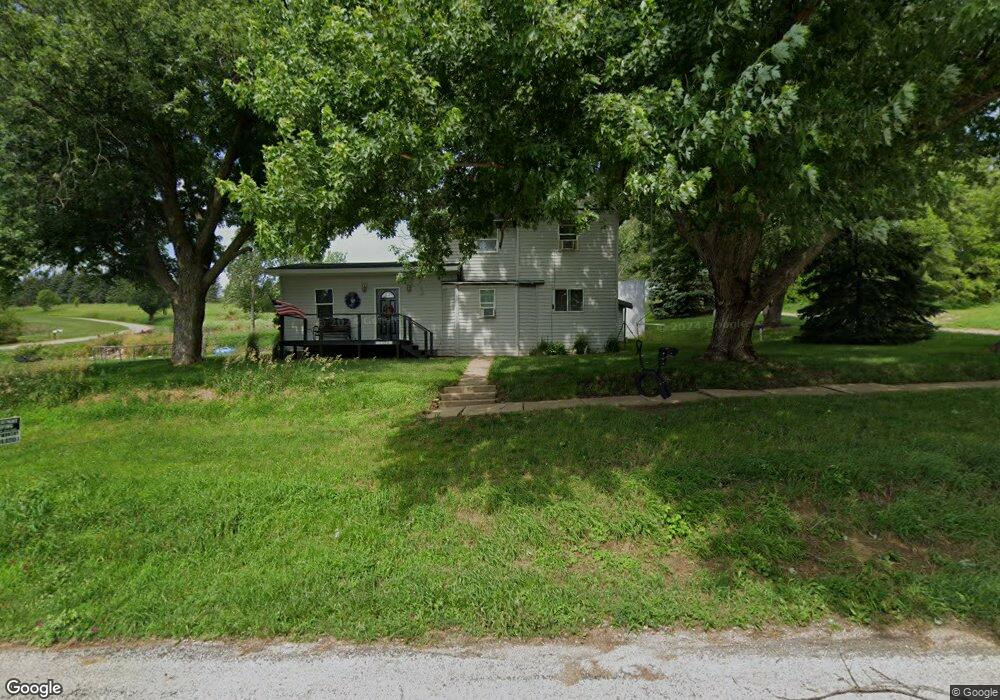
1104 S 16th St Tekamah, NE 68061
Estimated Value: $76,000 - $174,000
3
Beds
1
Bath
1,556
Sq Ft
$82/Sq Ft
Est. Value
About This Home
This home is located at 1104 S 16th St, Tekamah, NE 68061 and is currently estimated at $127,362, approximately $81 per square foot. 1104 S 16th St is a home located in Burt County with nearby schools including High School at Tekamah.
Ownership History
Date
Name
Owned For
Owner Type
Purchase Details
Closed on
Sep 3, 2020
Sold by
Jazz Up Indy Inc
Bought by
Coastal New Town Llc and Equity Trust Co
Current Estimated Value
Purchase Details
Closed on
Nov 25, 2013
Sold by
Bat Holdings Two Llc
Bought by
Acm Vision V Llc
Purchase Details
Closed on
Oct 19, 2012
Sold by
Federal National Mortgage Association
Bought by
Bat Holdings Two Llc
Purchase Details
Closed on
Aug 4, 2011
Sold by
Rue Thomas C
Bought by
Bank Of America Na
Purchase Details
Closed on
Sep 28, 2006
Sold by
Culver Justin David
Bought by
Rue Thomas C
Purchase Details
Closed on
Jul 1, 2005
Sold by
Deutsche Bank National Trust Co
Bought by
Culver Justin David
Create a Home Valuation Report for This Property
The Home Valuation Report is an in-depth analysis detailing your home's value as well as a comparison with similar homes in the area
Home Values in the Area
Average Home Value in this Area
Purchase History
| Date | Buyer | Sale Price | Title Company |
|---|---|---|---|
| Coastal New Town Llc | $15,000 | None Available | |
| Acm Vision V Llc | -- | None Available | |
| Bat Holdings Two Llc | $9,350 | None Available | |
| Bank Of America Na | -- | Lawyers Title Insurance | |
| Rue Thomas C | $36,000 | None Available | |
| Culver Justin David | $15,000 | None Available |
Source: Public Records
Tax History Compared to Growth
Tax History
| Year | Tax Paid | Tax Assessment Tax Assessment Total Assessment is a certain percentage of the fair market value that is determined by local assessors to be the total taxable value of land and additions on the property. | Land | Improvement |
|---|---|---|---|---|
| 2024 | $584 | $42,542 | $9,400 | $33,142 |
| 2023 | $694 | $37,853 | $8,700 | $29,153 |
| 2022 | $778 | $36,453 | $8,000 | $28,453 |
| 2021 | $736 | $39,132 | $6,300 | $32,832 |
| 2020 | $698 | $37,900 | $6,300 | $31,600 |
| 2019 | $712 | $41,448 | $6,300 | $35,148 |
| 2018 | $723 | $41,448 | $6,300 | $35,148 |
| 2017 | $719 | $37,965 | $6,300 | $31,665 |
| 2015 | $706 | $36,165 | $4,500 | $31,665 |
| 2013 | $777 | $36,165 | $4,500 | $31,665 |
Source: Public Records
Map
Nearby Homes
- 805 S 16th St
- 619 S 13th St
- 1413 I St
- 514 S 12th St
- 412 S 12th St
- 1422 N St
- 329 S 7th St
- 300 S 7th St
- 1516 O St
- 513 N 12th St
- 1116 S St
- Lot 151 Northridge Country Club
- Lot 118 Northridge Country Club
- 3850 Road K
- County Road 45 Road Fg
- 0 County Road 47
- 580 County Road 23
- 4701 County Road F
- 408 Main St
- 20636 Chippewa Cree Ln