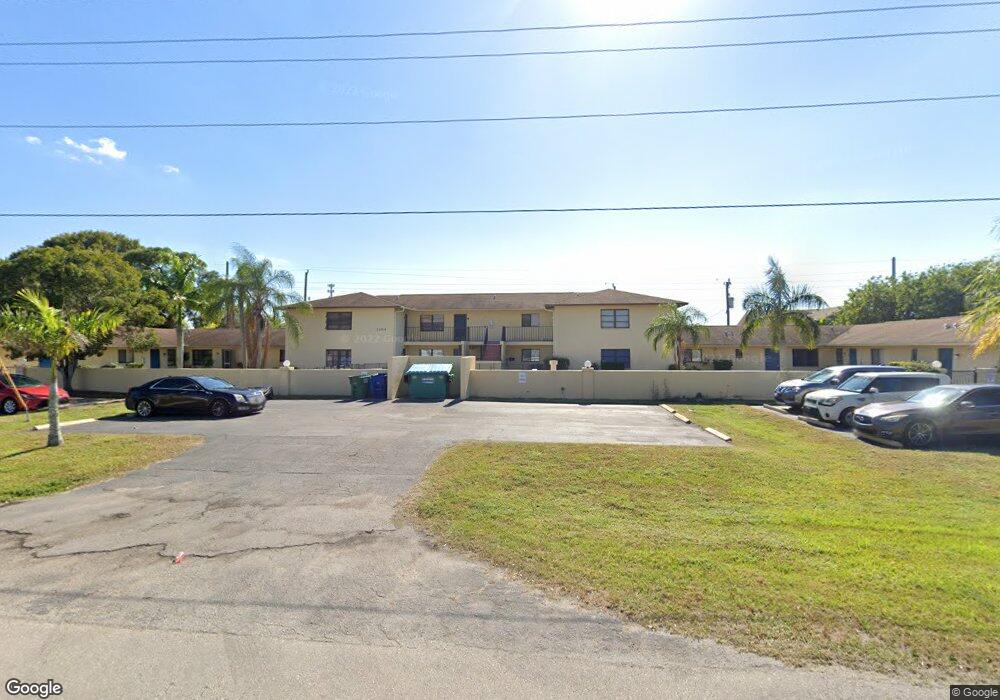
1104 SE 8th St Unit 11 Cape Coral, FL 33990
Hancock NeighborhoodEstimated Value: $132,000 - $154,000
2
Beds
2
Baths
900
Sq Ft
$159/Sq Ft
Est. Value
About This Home
This home is located at 1104 SE 8th St Unit 11, Cape Coral, FL 33990 and is currently estimated at $142,923, approximately $158 per square foot. 1104 SE 8th St Unit 11 is a home located in Lee County with nearby schools including Caloosa Elementary School, Tropic Isles Elementary School, and Hancock Creek Elementary School.
Ownership History
Date
Name
Owned For
Owner Type
Purchase Details
Closed on
May 15, 2018
Sold by
Pittro Joseph
Bought by
Pittro Joseph C and Joseph C Pittro Revocable Trust
Current Estimated Value
Purchase Details
Closed on
Sep 18, 2008
Sold by
Blanco Marie Jose
Bought by
Pittro Joseph
Purchase Details
Closed on
Jul 5, 2005
Sold by
Smith Richard and Smith Patricia
Bought by
Blanco Marie Jose
Home Financials for this Owner
Home Financials are based on the most recent Mortgage that was taken out on this home.
Original Mortgage
$110,400
Interest Rate
7.32%
Mortgage Type
Fannie Mae Freddie Mac
Purchase Details
Closed on
Apr 29, 2003
Sold by
Barry Anthony W and Barry Jacqueline
Bought by
Smith Richard and Smith Patricia
Home Financials for this Owner
Home Financials are based on the most recent Mortgage that was taken out on this home.
Original Mortgage
$58,500
Interest Rate
5.79%
Create a Home Valuation Report for This Property
The Home Valuation Report is an in-depth analysis detailing your home's value as well as a comparison with similar homes in the area
Home Values in the Area
Average Home Value in this Area
Purchase History
| Date | Buyer | Sale Price | Title Company |
|---|---|---|---|
| Pittro Joseph C | -- | Attorney | |
| Pittro Joseph | $53,500 | First Priority Title Llc | |
| Blanco Marie Jose | $138,000 | Tradewinds Title Inc | |
| Smith Richard | $65,000 | -- |
Source: Public Records
Mortgage History
| Date | Status | Borrower | Loan Amount |
|---|---|---|---|
| Previous Owner | Blanco Marie Jose | $110,400 | |
| Previous Owner | Smith Richard | $58,500 |
Source: Public Records
Tax History Compared to Growth
Tax History
| Year | Tax Paid | Tax Assessment Tax Assessment Total Assessment is a certain percentage of the fair market value that is determined by local assessors to be the total taxable value of land and additions on the property. | Land | Improvement |
|---|---|---|---|---|
| 2025 | $2,029 | $73,533 | -- | -- |
| 2024 | $1,778 | $66,848 | -- | -- |
| 2023 | $1,778 | $60,771 | $0 | $0 |
| 2022 | $1,469 | $55,246 | $0 | $0 |
| 2021 | $1,259 | $70,129 | $0 | $70,129 |
| 2020 | $1,189 | $63,793 | $0 | $63,793 |
| 2019 | $1,131 | $63,793 | $0 | $63,793 |
| 2018 | $1,098 | $63,793 | $0 | $63,793 |
| 2017 | $1,016 | $57,333 | $0 | $57,333 |
| 2016 | $928 | $49,933 | $0 | $49,933 |
| 2015 | $854 | $43,800 | $0 | $43,800 |
| 2014 | $730 | $36,520 | $0 | $36,520 |
| 2013 | -- | $30,600 | $0 | $30,600 |
Source: Public Records
Map
Nearby Homes
- 1104 SE 8th St Unit 5
- 1031 SE 8th Terrace Unit 2H
- 711 SE 11th Ave
- 1111 SE 8th Terrace Unit 3B
- 711 SE 12th Ave Unit 134
- 711 SE 12th Ave Unit 136
- 711 SE 12th Ave Unit 135
- 717 SE 10th Ave
- 629 SE 10th Place
- 623 SE 12th Ave Unit 121
- 623 SE 12th Ave Unit 123
- 727 SE 10th Ave
- 616 SE 11th Ave
- 1210 SE 6th Terrace Unit 87
- 1212 SE 6th Terrace Unit 83
- 646 SE 12th Ct Unit 18
- 707 SE 9th Place
- 916 SE 8th Terrace
- 429 SE 7th St
- 706,712,718 SE 7th St
- 1104 SE 8th St
- 1102 SE 8th St
- 1104 SE 8th St Unit 12
- 1104 SE 8th St Unit 1
- 1104 SE 8th St Unit 4
- 1104 SE 8th St Unit 10
- 1104 SE 8th St Unit 7
- 1104 SE 8th St Unit 2
- 1104 SE 8th St Unit 3
- 1104 SE 8th St Unit 9
- 1031 SE 8th Terrace Unit F
- 1031 SE 8th Terrace Unit G
- 1031 SE 8th Terrace Unit H
- 1031 SE 8th Terrace Unit C
- 1031 SE 8th Terrace Unit B
- 1031 SE 8th Terrace Unit A
- 1031 SE 8th Terrace Unit D
- 1031 SE 8th Terrace Unit E
- 1031 SE 8th Terrace Unit 2C
- 1112/1114 SE 8th St