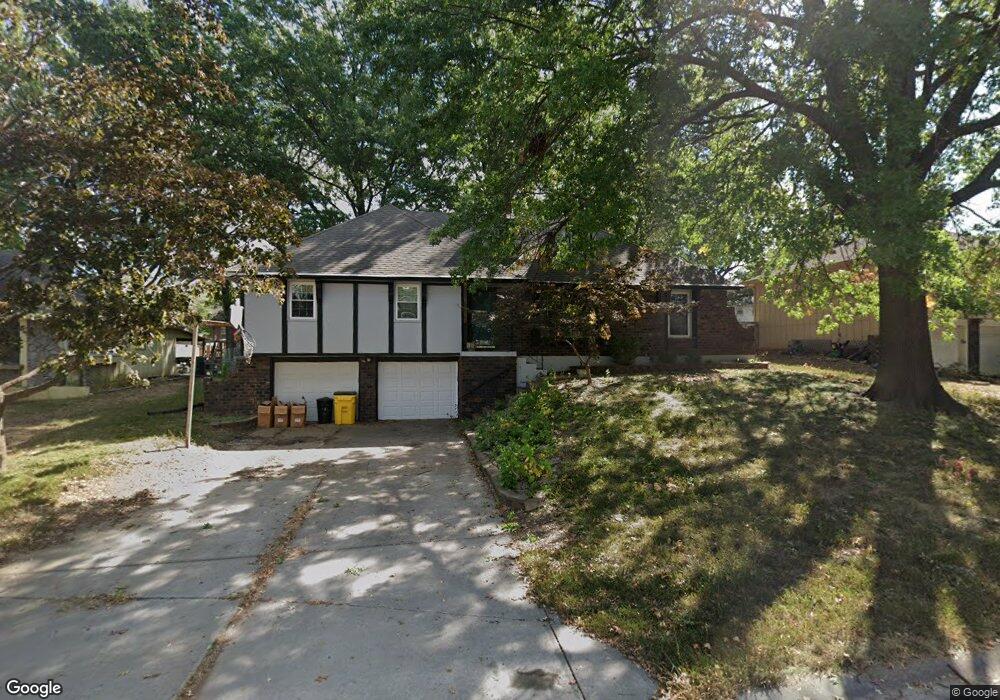
1104 SW 18th St Blue Springs, MO 64015
Estimated Value: $265,000 - $289,000
3
Beds
2
Baths
1,638
Sq Ft
$167/Sq Ft
Est. Value
About This Home
This home is located at 1104 SW 18th St, Blue Springs, MO 64015 and is currently estimated at $273,776, approximately $167 per square foot. 1104 SW 18th St is a home located in Jackson County with nearby schools including Franklin Smith Elementary School, Moreland Ridge Middle School, and Blue Springs South High School.
Ownership History
Date
Name
Owned For
Owner Type
Purchase Details
Closed on
Jun 3, 2011
Sold by
Anderson Christopher A
Bought by
Worth Tammy L
Current Estimated Value
Purchase Details
Closed on
Sep 23, 2004
Sold by
Brooke Phillip and Brooke Debra
Bought by
Anderson Christopher A and Worth Tammy L
Home Financials for this Owner
Home Financials are based on the most recent Mortgage that was taken out on this home.
Original Mortgage
$96,400
Interest Rate
7.75%
Mortgage Type
Purchase Money Mortgage
Purchase Details
Closed on
May 25, 2000
Sold by
Cindrich Fred P and Cindrich Mary Kay
Bought by
Brooke Phillip and Brooke Debra
Home Financials for this Owner
Home Financials are based on the most recent Mortgage that was taken out on this home.
Original Mortgage
$119,799
Interest Rate
8.14%
Mortgage Type
VA
Create a Home Valuation Report for This Property
The Home Valuation Report is an in-depth analysis detailing your home's value as well as a comparison with similar homes in the area
Home Values in the Area
Average Home Value in this Area
Purchase History
| Date | Buyer | Sale Price | Title Company |
|---|---|---|---|
| Worth Tammy L | -- | None Available | |
| Anderson Christopher A | -- | Kansas City Title | |
| Brooke Phillip | -- | Ati Title Company |
Source: Public Records
Mortgage History
| Date | Status | Borrower | Loan Amount |
|---|---|---|---|
| Previous Owner | Anderson Christopher A | $96,400 | |
| Previous Owner | Brooke Phillip | $119,799 | |
| Closed | Anderson Christopher A | $24,100 |
Source: Public Records
Tax History Compared to Growth
Tax History
| Year | Tax Paid | Tax Assessment Tax Assessment Total Assessment is a certain percentage of the fair market value that is determined by local assessors to be the total taxable value of land and additions on the property. | Land | Improvement |
|---|---|---|---|---|
| 2025 | $3,100 | $39,700 | $7,218 | $32,482 |
| 2024 | $3,041 | $38,000 | $7,119 | $30,881 |
| 2023 | $3,041 | $38,000 | $7,119 | $30,881 |
| 2022 | $2,718 | $30,020 | $3,695 | $26,325 |
| 2021 | $2,715 | $30,020 | $3,695 | $26,325 |
| 2020 | $2,550 | $28,671 | $3,695 | $24,976 |
| 2019 | $2,465 | $28,671 | $3,695 | $24,976 |
| 2018 | $2,229 | $24,954 | $3,216 | $21,738 |
| 2017 | $2,229 | $24,954 | $3,216 | $21,738 |
| 2016 | $2,046 | $22,971 | $3,363 | $19,608 |
| 2014 | $1,984 | $22,200 | $3,350 | $18,850 |
Source: Public Records
Map
Nearby Homes
- 1008 SW 17th St
- 1001 SW 18th St
- 1504 SW Sunset St
- 1331 SW Horizon Dr
- 1301 SW Sunrise Dr
- 1005 SW 23rd St
- 1604 SW 21st St
- 1201 SW Hopi St
- 1004 SW Twilight Ln
- 1311 SW 25th St
- 1203 SW 26th St
- 701 SW 17th St
- 1604 SW 18th Street Ct
- 1804 SW Cherokee Strip
- 1104 SW Mic-O-say Dr
- 1900 SW Cherokee Strip
- 1700 SW Mc Arthur St
- 505 SW 18th St
- 514 SW 15 St
- 1718 SW 24th St
- 1100 SW 18th St
- 1108 SW 18th St
- 1105 SW 17th St
- 1101 SW 17th St
- 1112 SW 18th St
- 1109 SW 17th St
- 1016 SW 18th St
- 1105 SW 18th St
- 1109 SW 18 St
- 1109 SW 18th St
- 1017 SW 17th St
- 1101 SW 18th St
- 1113 SW 18th St
- 1017 SW 18th St
- 1012 SW 18th St
- 1200 SW 18th St
- 1015 SW 17th St
- 1201 SW 17th St
- 1201 SW 18th St
- 1108 SW 19th St